Data Studies


Withings and AccuWeather teamed up to analyze the impact of weather on activity levels. Are men more responsive to extreme temperatures than women? Do people in sunny LA walk more than the rest of us? Read on to find out.
Born To Be Mild
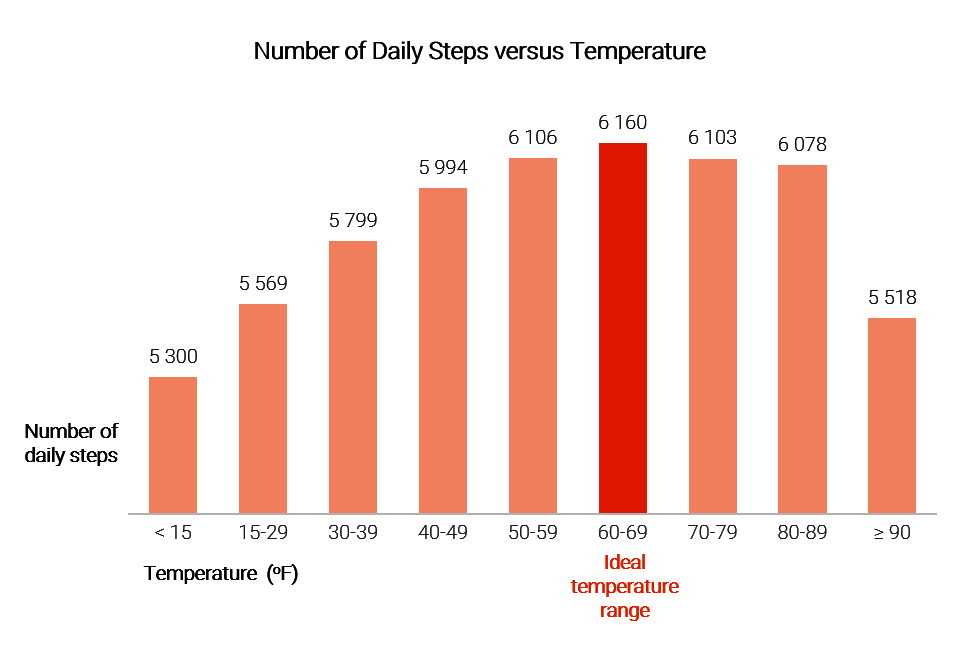
From the data collected, we identified 60-69°F as the preferred temperature range. Within this range, we notice the highest number of reported steps: 6,160. As the graph explains, once we move further from the preferred temperature range the average step count decreases. For the coldest reported temperatures (less than 15°F) there is an average of 860 steps or 14% difference from the preferred temperature. For the hottest reported temperatures (greater than 90°F) people walk an average of 642 (10%) fewer steps than they do when the temperature is in the preferred range.
The Preferred Temperature Range Varies Between Cities
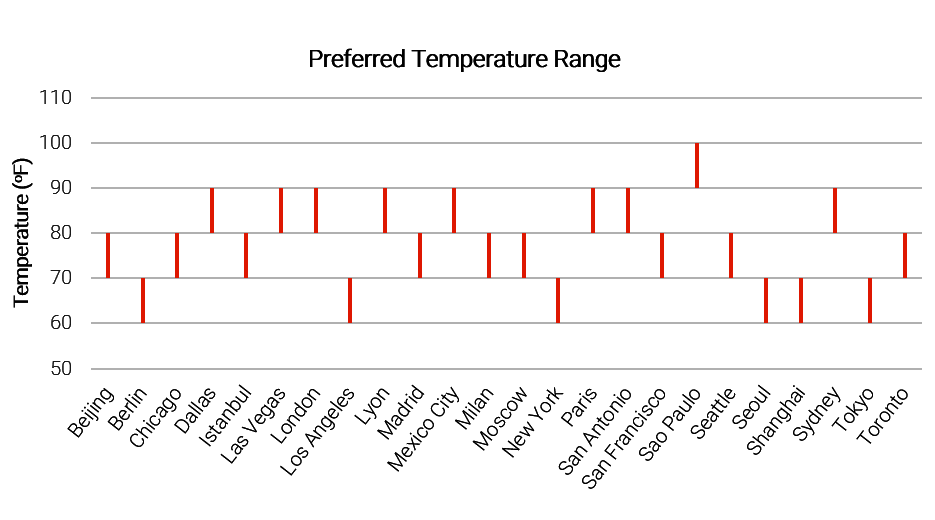
Just as the average temperature is different from one city to the next, the city’s average preferred temperature varies as well. In tropical climates such as Sao Paulo, Brazil where the average temperature throughout the year is hotter, the city’s inhabitants have a higher preferred temperature range. Though the average temperatures are different between the two cities (as Californians will constantly remind you) it’s interesting to note that LA and NY have the same preferred temperature range. Check out the preferred temperature range of the cities in our study below.
Too Hot, Too Cold, And The Cities That Get It Jussst Right
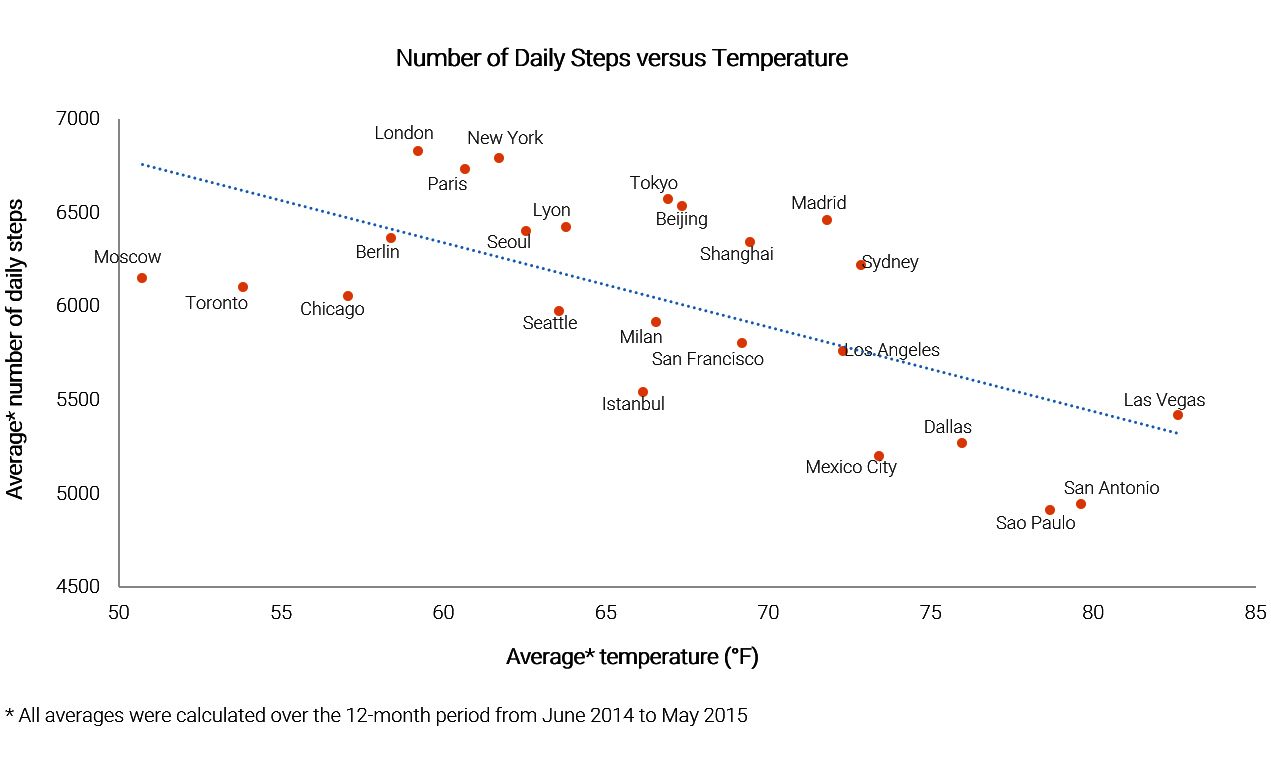
The average observed temperature varies between cities and has a meaningful impact on the average daily steps. Sao Paulo has the third highest temperature and the lowest reported number of daily steps at 4910 — which is 28% fewer than London, with an average temperature during the study of 59 degrees, and the highest number of steps. It’s interesting to note that the cities with the highest number of steps are in the moderate temperature range, which is consistent with the preferred temperature range. Shanghai and San Francisco have a similar average temperature but a 500-step variation in average steps. Looks like the rolling hills take a toll on activity levels! How does your city compare?

Body Cardio
Some Like It Hot
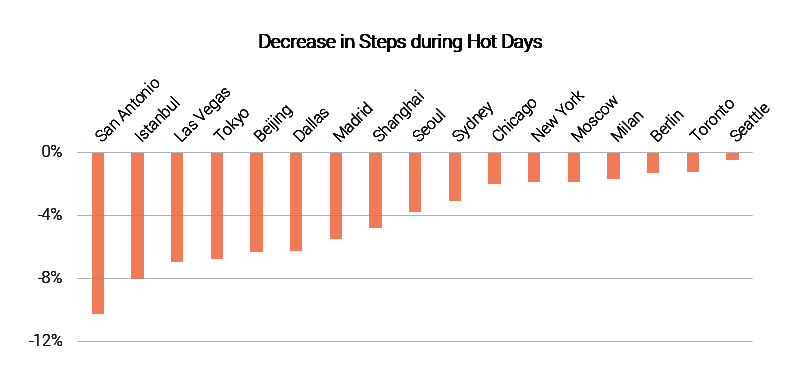
The graph below explains the step variation by city based on temperatures higher than the preferred range. San Antonio is most heavily impacted by higher temperatures with a 508 step difference or 10% variation, while in Seattle we see no difference.
A note about this graph: For some cities, the available data to calculate the response to heat was insufficient.
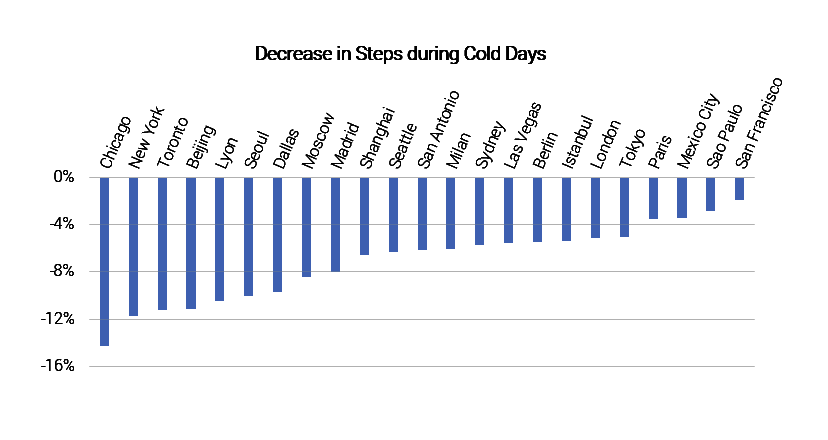
Some Like It Cold
The graph below compares response to cold between cities. In Chicago when the observed temperature is colder than the preferred range, people walk 864 or 14% fewer steps. In San Francisco when the temperature is colder than the preferred range there is little variation, only a 112 step or 2% difference. Keep in mind the average temperature in Chicago is much colder than San Francisco, so it makes sense that people would be more heavily impacted when temperature drops. Interestingly, we observe that people are more heavily affected by cold than heat. While the highest reported variation for cold temperatures is 14% (Chicago), the most variation we see due to extreme heat is 10% for San Antonio. Looking for a city with the best of both worlds? Check out Los Angeles, as temperature above and below the preferred range seems to have a minimal impact on activity levels.
Keep Your Jackets On, Fellas
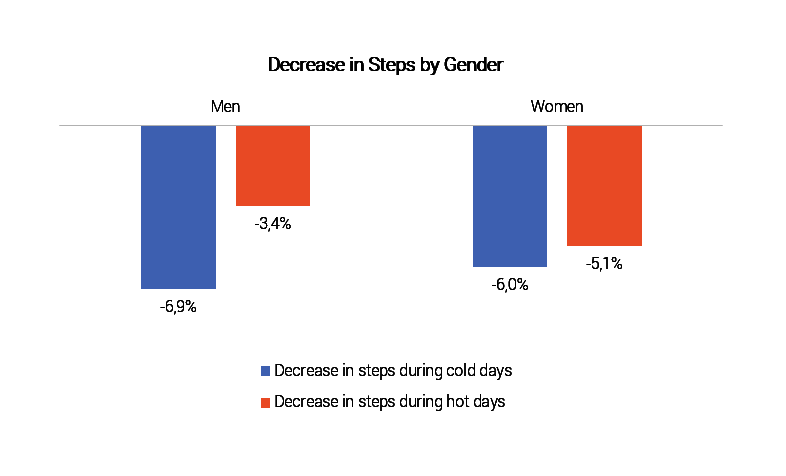
Though they’ll often disagree, data confirms that men are much more sensitive to cold than women. The step variation for women is approximately the same for extreme* heat and extreme cold, while men are much more affected by cold than heat. Though this data may be an interesting revelation to women everywhere, it is important to note that men are more active on a global level, with higher reported step counts.
* Extreme is defined by temperatures outside the preferred temperature range.
Thirty Something Going On Here?
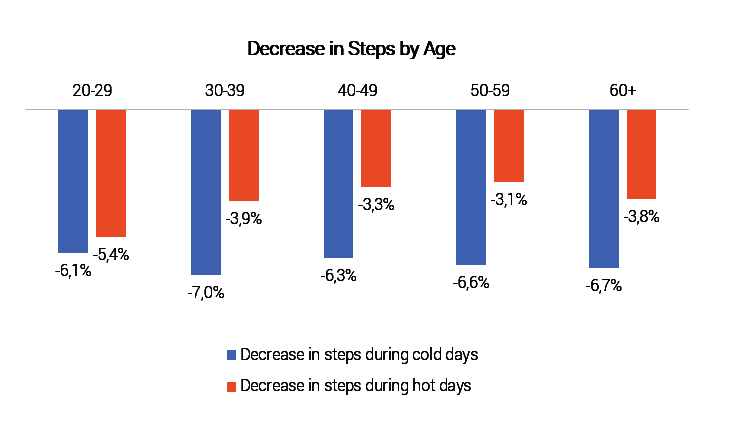
As with gender, we see that sensitivity to temperature is different among various age groups. According to the data, the 30-39 year-old age group is most sensitive to temperatures below the preferred range with 457 (7.0%) fewer reported steps. This can likely be attributed to the fact that the 30-39 age group is the most active. Running regiments and other outdoor physical activities are inevitably impacted by extreme weather conditions. We also notice that the 60+ age group had the second strongest overall response to cold. A possible explanation for this decrease is that many people in this age group are retired and have more time for leisurely activities such as walking, gardening, and other active pursuits. These activities are more likely to be impacted by weather changes than say, commuting to work, which is a necessity.
Rain Makes Activity Go Down the Drain
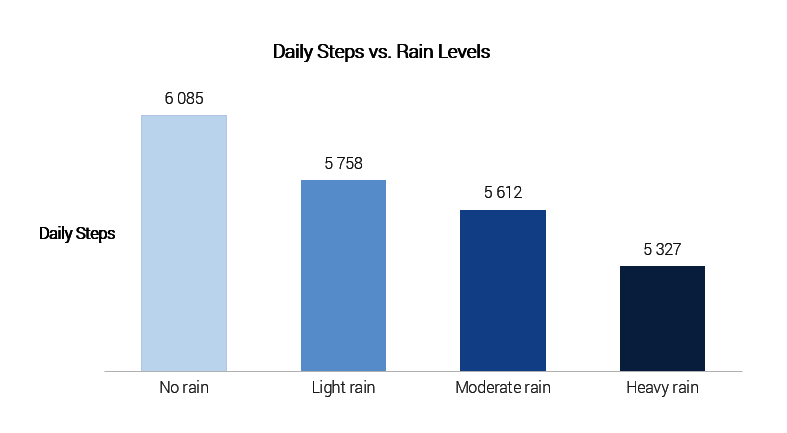
The data confirms what most of us would expect: step levels are impacted by rainfall. We notice a 758-step (or 12%) variation between days when there is heavy rainfall as compared to days without rain.
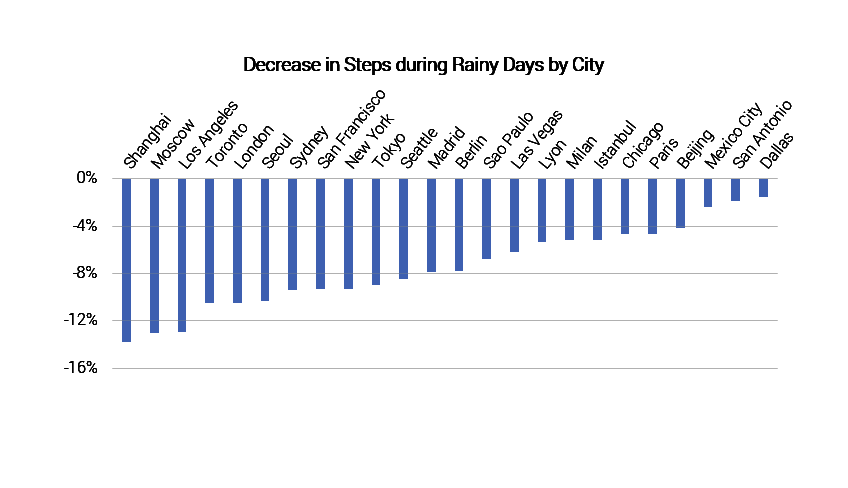
Singing In The Rain? Or Watching From The Window?
As with temperature variation, we observe rain sensitivity also varies by city. While people in Shanghai are highly impacted by rainfall, with 871 or 13% fewer steps, people in Dallas don’t seem as bothered by rain, as their variation is fewer than 100 steps. The rain in Spain may fall mainly in the plain, but it seems to be keeping a lot of people inside. Across our study of cities, we can see that people’s activity levels seem to be heavily impacted by rainfall. Earlier in our analysis we saw that step levels in Los Angeles were not heavily influenced by temperature changes, however, we see here that they are heavily impacted by rainfall, on the rare occasion it occurs.
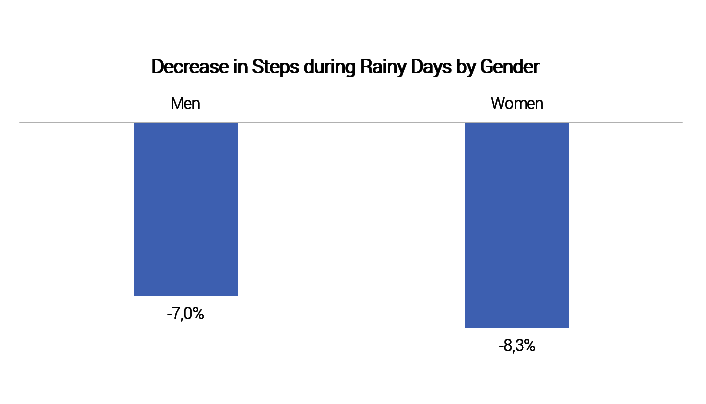
Rain, Rain Women Go Away
Men are more sensitive to the cold, but women are more sensitive to rain. We observe that women take on average 1.3% fewer steps than men when it rains.
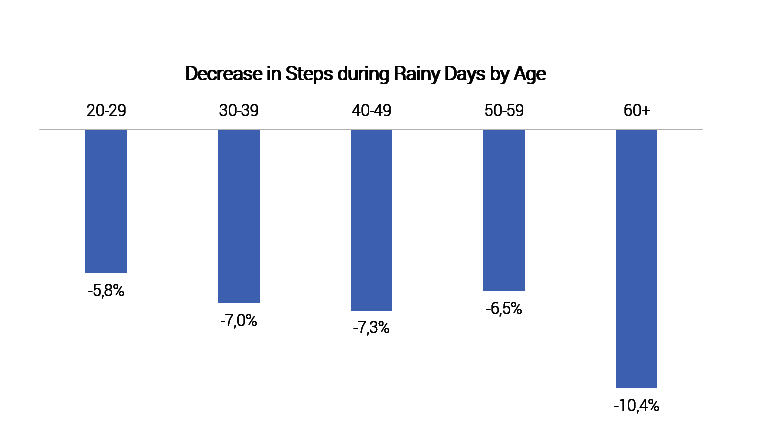
Youth Knows No Age, But Umbrellas Do
The 60+ age group is most sensitive to rain by a fair margin. As with temperature, we can likely attribute this variation to a higher likelihood of leisure activities in the years following retirement. If you walk to your car, the bus, the train, or all the way to work, this routine is unlikely to be impacted by rain or inclement weather. Walking for exercise or with friends on the other hand, is likely to be impacted by inclement weather. People are much less likely to go for a leisurely stroll when it is raining than when it is sunny.
Weather or not we want to admit it, temperature and rainfall have an impact on our activity levels. Some like it hot, some like it cold, but most of us were just born to be mild. Men aren’t as immune to cold as they would like us to believe, and people are overall more affected by cold than heat. Bundle up and grab an umbrella to boost those activity levels.
Methodology
AccuWeather and Withings studied one year of weather and anonymized step data for 24 cities all around the world. For each city and each day, we analyzed the temperature, the rainfall and the average number of steps walked by people in each city.
The rain levels are the following:
- No rain: 0-0.25″ of rain during the day
- Light rain: 0.25-0.50″ of rain during the day
- Moderate rain: 0.50-1″ of rain during the day
- Heavy rain: More than 1″ of rain during the day
For rain analysis, only the days with temperature greater than 36°F and no snow were analyzed.