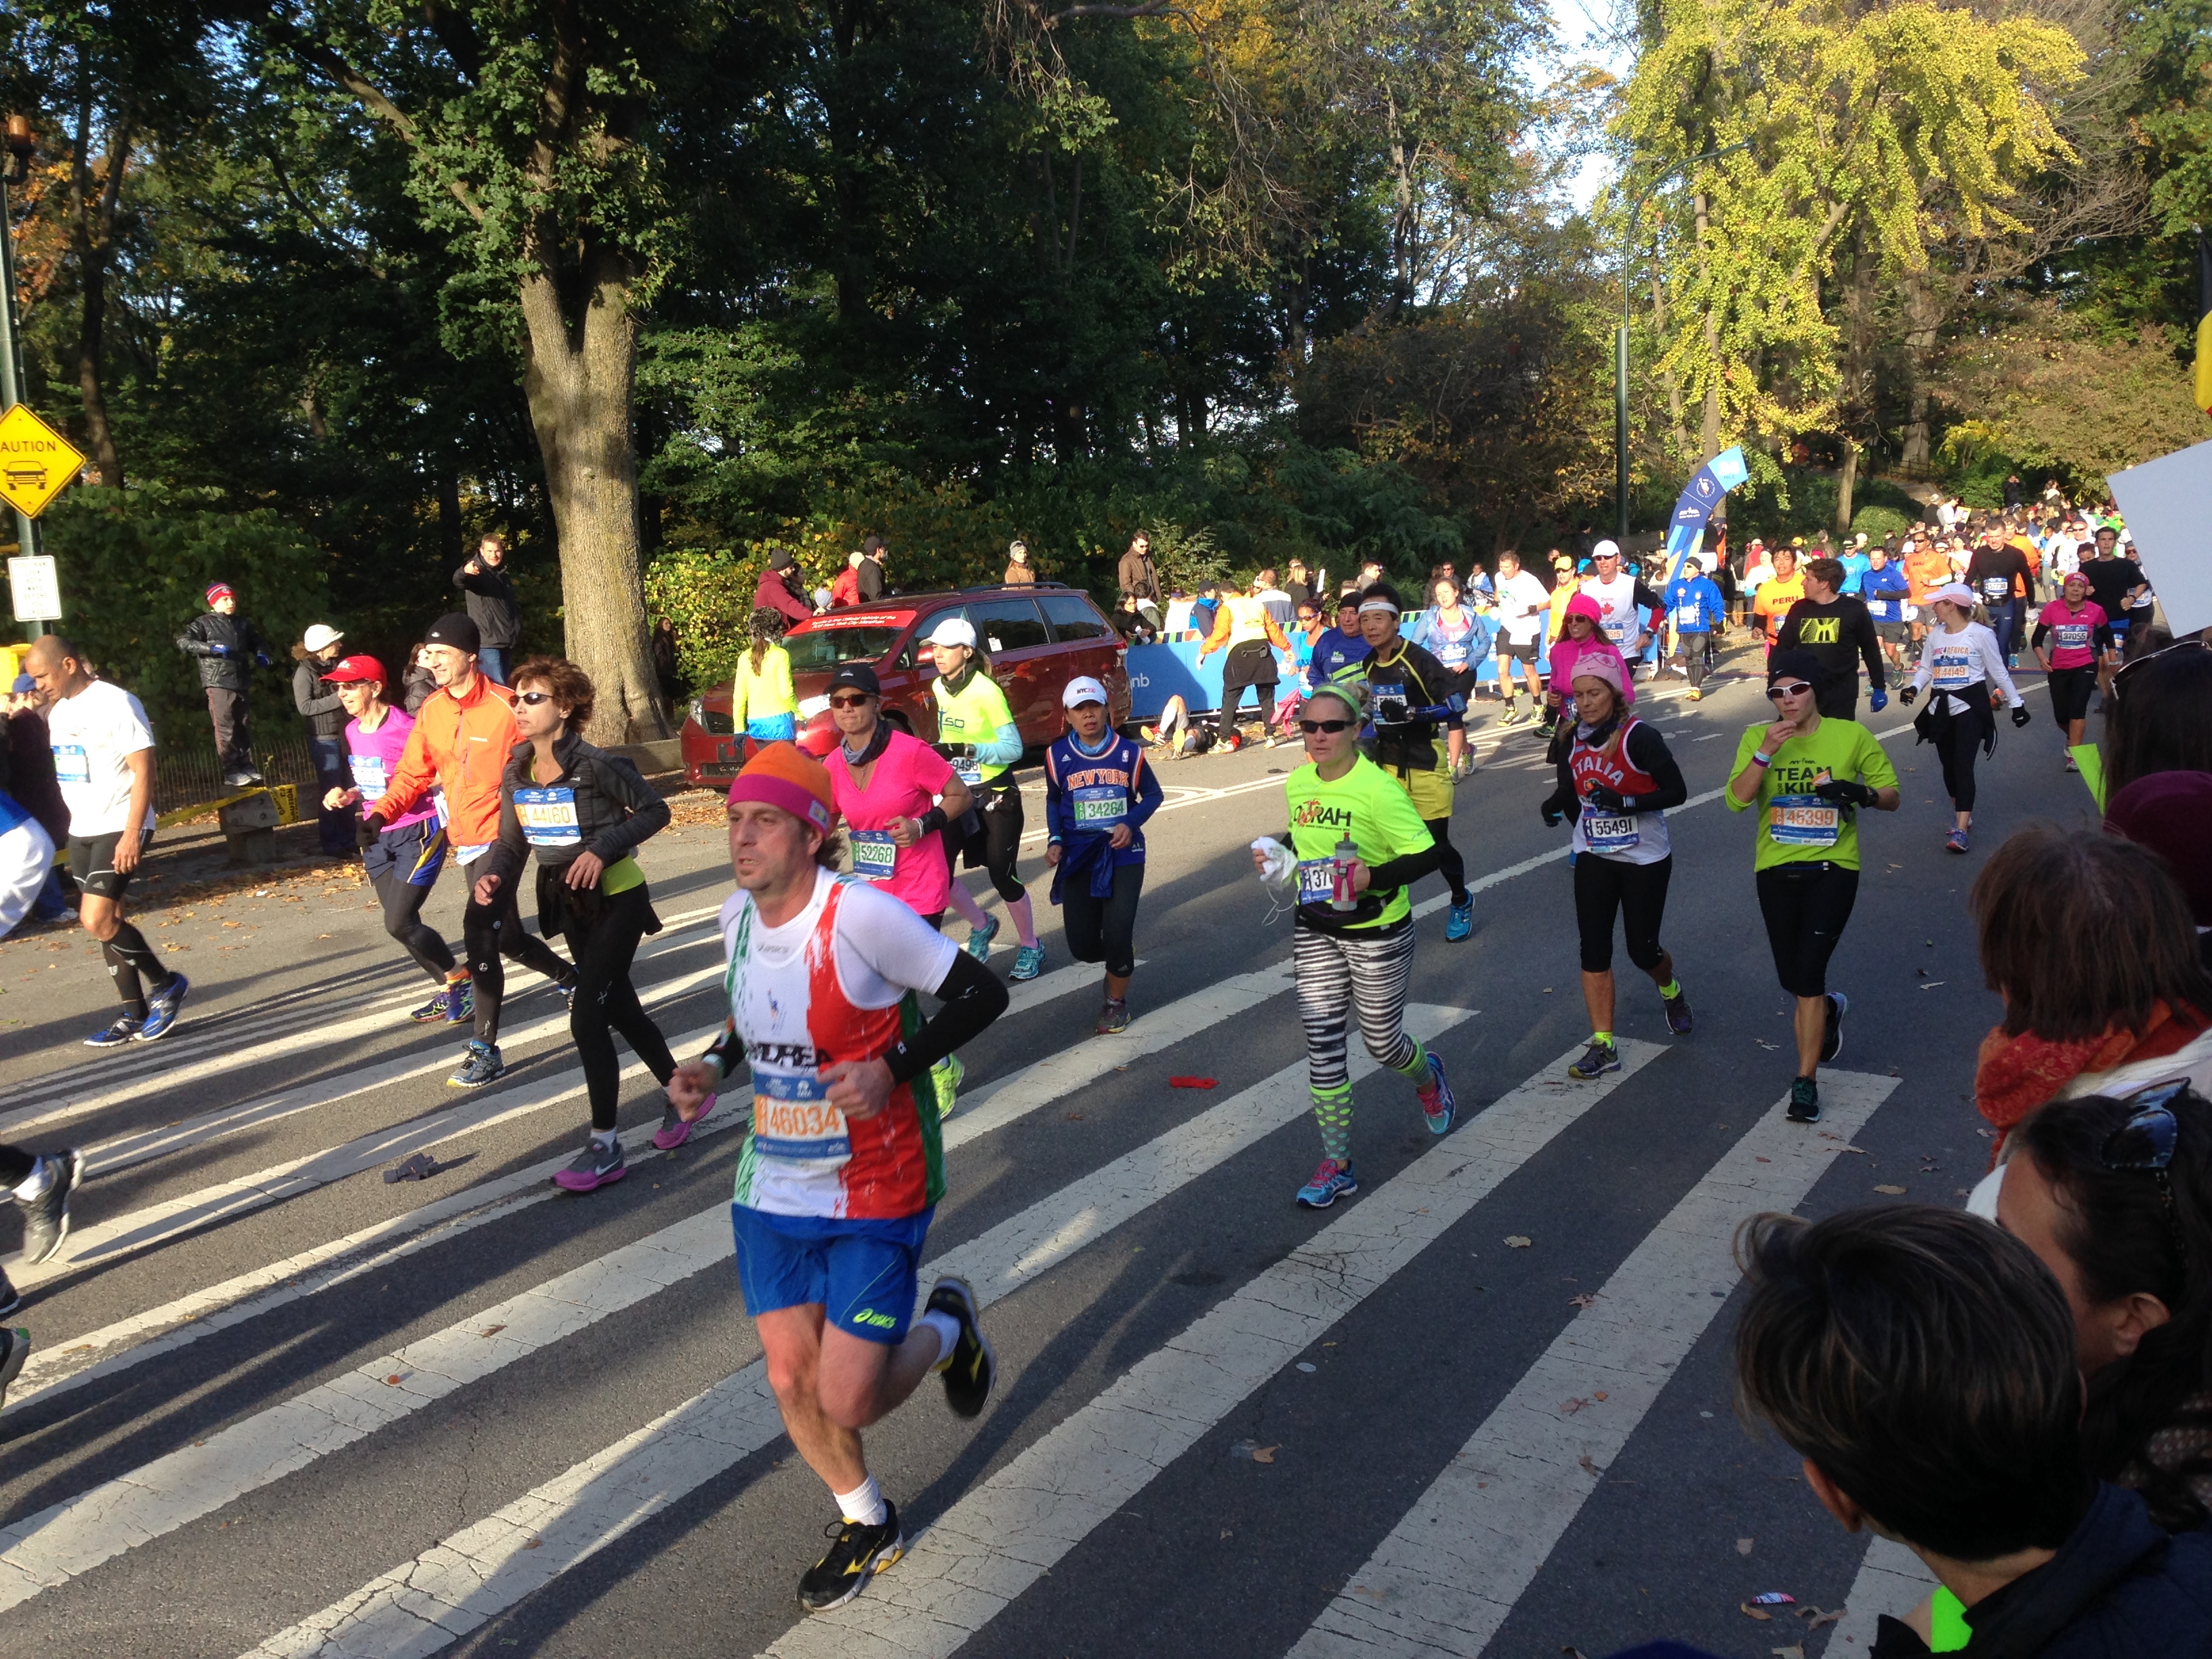
On Sunday November 2nd, runners gathered from all over the world to run the New York City Marathon.
Among the 50,000 runners who competed to complete the 26.2-mile course, there were several Withings Pulse wearers. We decided to take a closer look at the Pulse marathon runners. Pulse wearers finished the marathon on average in 3h40, far below the 4h34 reported as the average of all participants.
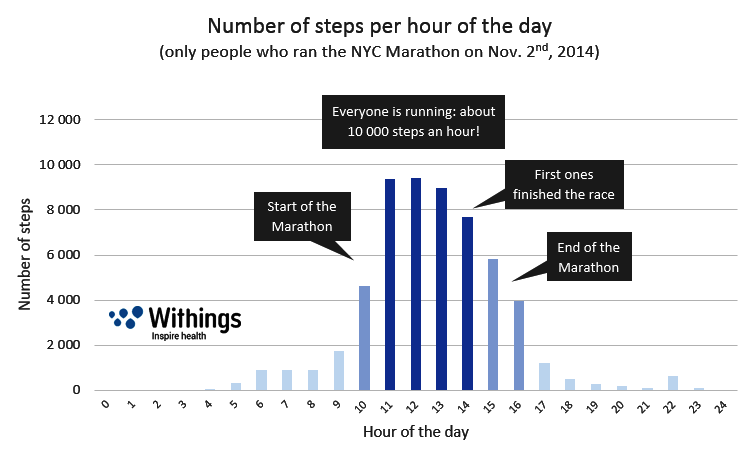
If we examine the distribution of the number of steps per hour of the day, we can see that:
1: There were several departure waves between 10am and 11am. 10 am was the start time of the marathon for non-professional runners.
2: From 11am to 2pm, all runners were in action, at the electric pace of almost 10,000 steps per hour!
3: After 2pm, the average pace decreased, due to the first runners having finished the race and other runners having lowered their speed during the last miles.
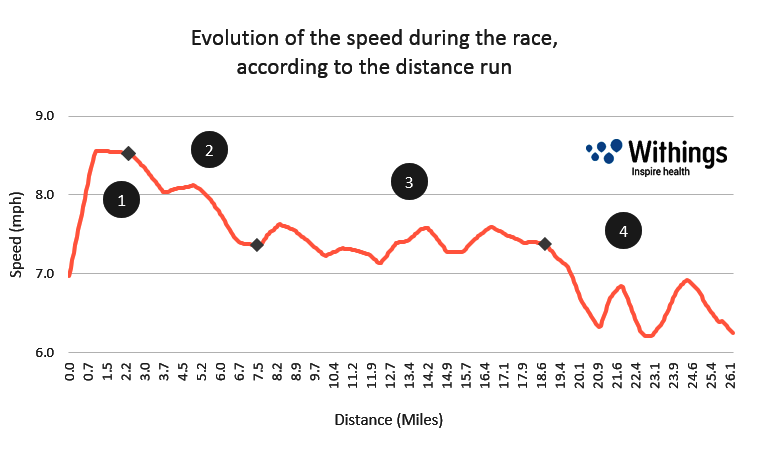
We can also analyze how the runners’ average speed varied according to the run distance. The following graph reveals that:
1: During the first 1.5 miles the runners increase their speed to reach a maximum average speed of 8.6 mph.
2: Then, until mile 6, their speed decreased gradually until stabilizing at a cruising speed of 7.4 mph.
3: Runners kept their pace at this average cruising speed until mile 20.
4: From mile 20, we observe a significant drop, with some fluctuations between 6.2 and 6.8 mph until the end of the race. Runners probably hit the famous “marathon wall”, related to the depletion of glycogen in the body which occurs typically around
the 20 mile mark .
A second interesting way of analyzing the speed evolution throughout the race is to compare this evolution against the elevation profile of the circuit. The following graph displays this relationship. In this graph, we have superposed speed and elevation, so that we can better visualize the potential links between these two variables.
1: The speed increases in the beginning of the marathon, even if during the first 1.5 miles the ascent seems steep. The speed reaches a maximum and is kept at this level from the moment when the elevation decreases and runners start descending.
2: The elevation varies little during this phase. The speed decreases gradually, due to some increases in elevation but also to runners showing the first signs of tiredness after the first 4 miles of the race.
3: The speed then stabilizes at 7.4 mph. We can observe a peak in the elevation profile at 15.5 miles, and the accompanying dip in the speed curve.
4: In the last phase of the race, the speed decreases again and oscillates between 6.2 and 6.8 mph until the end. This phase is characterized by an overall positive elevation variation. Knowing that at this point runners have already run 20 miles, the observed decrease in speed is very logical.

Congratulations to all these runners that powered through until the last mile and were able to cross the finish line of the 2014 NYC Marathon! Did you know that a subject weighing 160 lb burns over 3000 kcal during a marathon? A well-deserved rest period is now required. On our side, we will see you again in March 2015 for the next edition of the Paris Marathon!
About the data
This study was conducted upon a panel of users of the Withings Pulse in the US. Withings guarantees the confidentiality of personal data and protects the privacy of all its users. Therefore, all data used for this study are anonymized and aggregated.