Withings studied how pollution impacts our daily lives — in particular, how it impacts our physical activity levels. What did we discover? Read on to find out?
Over 100 world leaders are gathered in Paris this week, for a 12-day summit to discuss climate change at COP21 — The United Nations Conference on Climate Change.To contribute to the debate, Withings studied how pollution impacts our daily lives – in particular, how it impacts our physical activity levels. Withings worked with AccuWeather to analyze historical pollution data in three major cities, Paris, Los Angeles and Beijing, and associated this data with activity levels measured by Withings activity trackers.
Pollution was measured by the concentration of fine particles in the air – particulate matter with a diameter of 2.5 micrometers or less, commonly named PM2.5. Fine particles are produced from all types of combustion activities (vehicles, power plants, residential wood burning), and some industrial processes. Due to their very small size (1/30th of the width of a human hair), fine particles can lodge deeply in the lungs, and are believed to pose many health risks, from simple eye irritation to increased risk of heart attack.
Regarding activity levels, we were interested to see if sport enthusiasts would maintain the same activity level or reduce it during days with higher pollution levels, to avoid exposure. To find the answer, we analyzed daily exercise duration only for users that practice a moderate or an intense activity (going from a fast-paced walk to a running session).
Beijing: far more polluted than Paris and L.A.
Let’s first take a look at the pollution levels in these three cities: Paris, Los Angeles and Beijing. The French capital is in the top ten most polluted cities in Europe, whereas Los Angeles is frequently ranked as the most polluted city in the U.S.. In Beijing, however, pollution reaches another level: the Chinese city is one of the world’s most polluted cities.
The U.S. EPA defines seven categories of air quality: good, moderate, unhealthy for sensitive groups, unhealthy, very unhealthy, hazardous and very hazardous. We classified each day of the year 2014 according to these categories.
[raw]
[/raw]
Throughout 2014, the air quality in Paris was good 44% of the time, and 56% of the days saw pollution levels above the threshold of good air quality (including 4% classified as unhealthy for sensitive groups or unhealthy). LA saw 67% of days above the pollution threshold. Finally, Beijing lived 97% of days above the pollution threshold, with 65% of the days considered unhealthy, very unhealthy, hazardous or even very hazardous.
The figure below shows the evolution of PM2.5 concentrations throughout the year, in all three cities. The red line indicated the pollution threshold. We note Beijing’s curve far above the other two.
[raw]
[/raw]
According to a specialist cited by The Economist, breathing Beijing’s air is equivalent to smoking almost 40 cigarettes a day. He also estimates air pollution to cause 1.6 million deaths a year in China, accounting for 17% of the total deaths.
Pollution data sources: AccuWeather for Los Angeles, Airparif for Paris and StateAir for Beijing.
Adapting exercise times due to pollution — not a common practice in LA or Paris, but a necessity in Beijing
In Los Angeles, active people stuck to their exercise routine regardless of pollution levels. We see that during polluted days, the exercise duration is almost the same as during days with good air quality.
[raw]
[/raw]
In Paris, exercise duration increased slightly during polluted days. Although that seems surprising, one possible explanation comes from the fact the most polluted days were not the coldest days of the year. As seen in a previous study on weather and activity levels, people tend to exercise more in temperate conditions.
[raw]
[/raw]
In Paris, like in Los Angeles, it seems that pollution does not make people change their exercising habits. However, this is not the case for Beijing. Beijingers exercise significantly less during polluted days: we see that during days where air quality was categorized very hazardous, Beijingers exercised for periods 17% shorter than during days with good air quality.
[raw]
[/raw]
How to stay active in a polluted city
Pollution and exercise can be an unhealthy combination. When you exercise, the air you breath in is less filtered by the nasal passages, increasing the lung’s exposure to pollution particles. But of course, it’s widely known that exercise offers multiple benefits for health. So, how do you stay active if you are living in a polluted city? Some actions can be taken to limit the effects of pollution.
First, avoid peak pollution hours. The objective is not to stop exercising, but rather to give preference to days and hours with better air quality. To do so, monitor air pollution levels in your city. Usually, pollution is significantly lower in the early morning hours or after sunset.
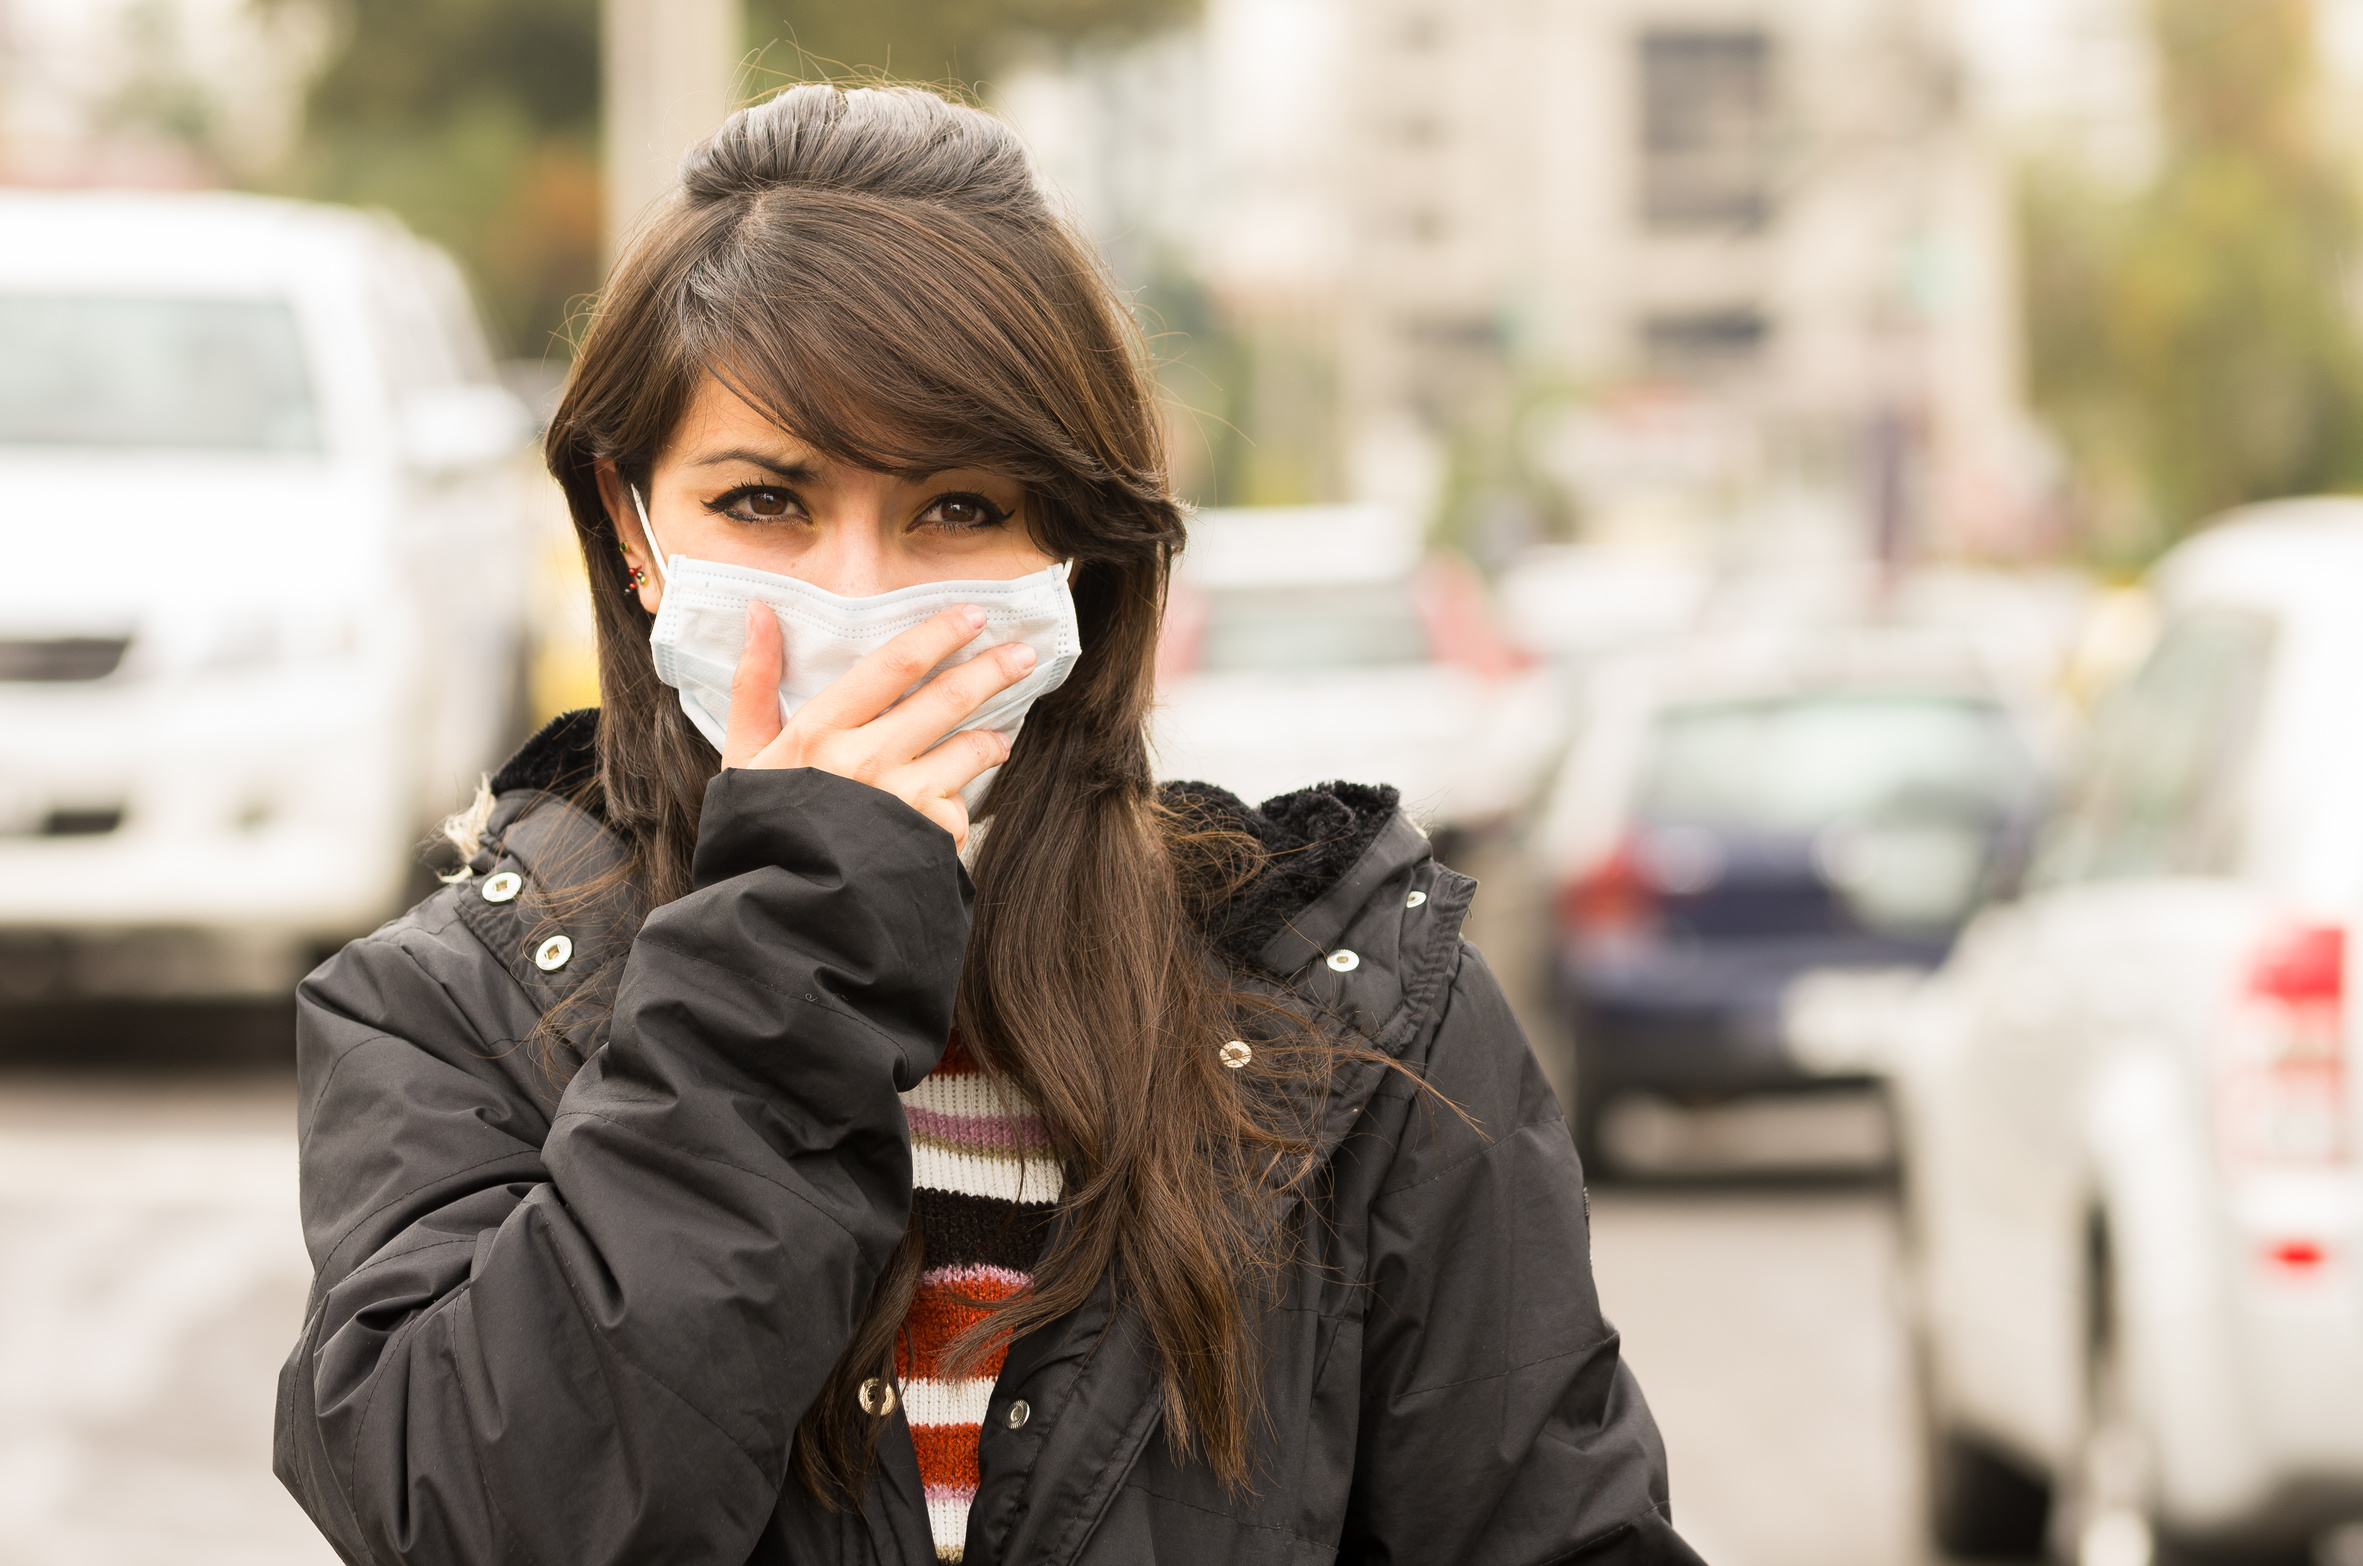
Then, go to a park. Pollution is likely to be much higher close to roads. Plan your workout in a green area, outside the city center. If this is not possible, it is preferable to exercise indoors during pollution peaks. Another option, seen in heavily polluted cities, is to wear a mask that filters pollution particles.
Finally, do not forget to contribute to a better environment! Pollution touches everyone’s daily lives – so it should be a topic on everyone’s agenda. We all need to strive to educate ourselves, join the discussion, and aim to use energy responsibly.
About the study
This study was conducted by Withings, based on data from a panel of users of Withings activity trackers that practice moderate or intense physical activities (fast-paced walking and running are examples of moderate and intense activities, respectively). The exercise durations displayed correspond to the sum of moderate and intense activities durations. All data are daily averages.
Withings guarantees the confidentiality of personal data and protects the privacy of all its users. Therefore, all data used for this study was rigorously anonymized and aggregated.
Pollution data was provided by Airparif, AccuWeather and StateAir for the cities of Paris, Los Angeles and Beijing, in the form of 24-hour averages of PM2.5 concentrations (μg/m3). Classification in air quality categories follow the Air Quality Index and EPA’s threshold values.
[raw]
[/raw]