Data Studies

We took a long look at how global health metrics fared in 2020 vs. 2019. Read on for all the details.
The words “year in review” may cause you to sigh and then slowly head for the hills to get away from the most disruptive time for human health in recent memory. However, as we found in our Covid-19 data study conducted in May, not all was lost during the pandemic with trends gearing towards more sleep, no drastic weight gain, and decreased sleep heart rates.
But as the pandemic moved, ebbed, and flowed across the globe, how have these trends held or changed after a much longer period of time? We certainly feel like the end of the year can’t come soon enough, as evidenced by the wide array of 2020 dumpster fire holiday ornaments for sale. Do we chalk 2020 up to a loss? Read on for the sometimes surprising results.
2020: We tried to sleep through it
Not only did people not lose any sleep during the year, they actually gained some. On average people slept eight minutes and 34 seconds more per night in 2020 than in 2019, with the United Kingdom gaining the most in longer sleep times with average eleven minutes and 40 seconds more per night than the previous year.
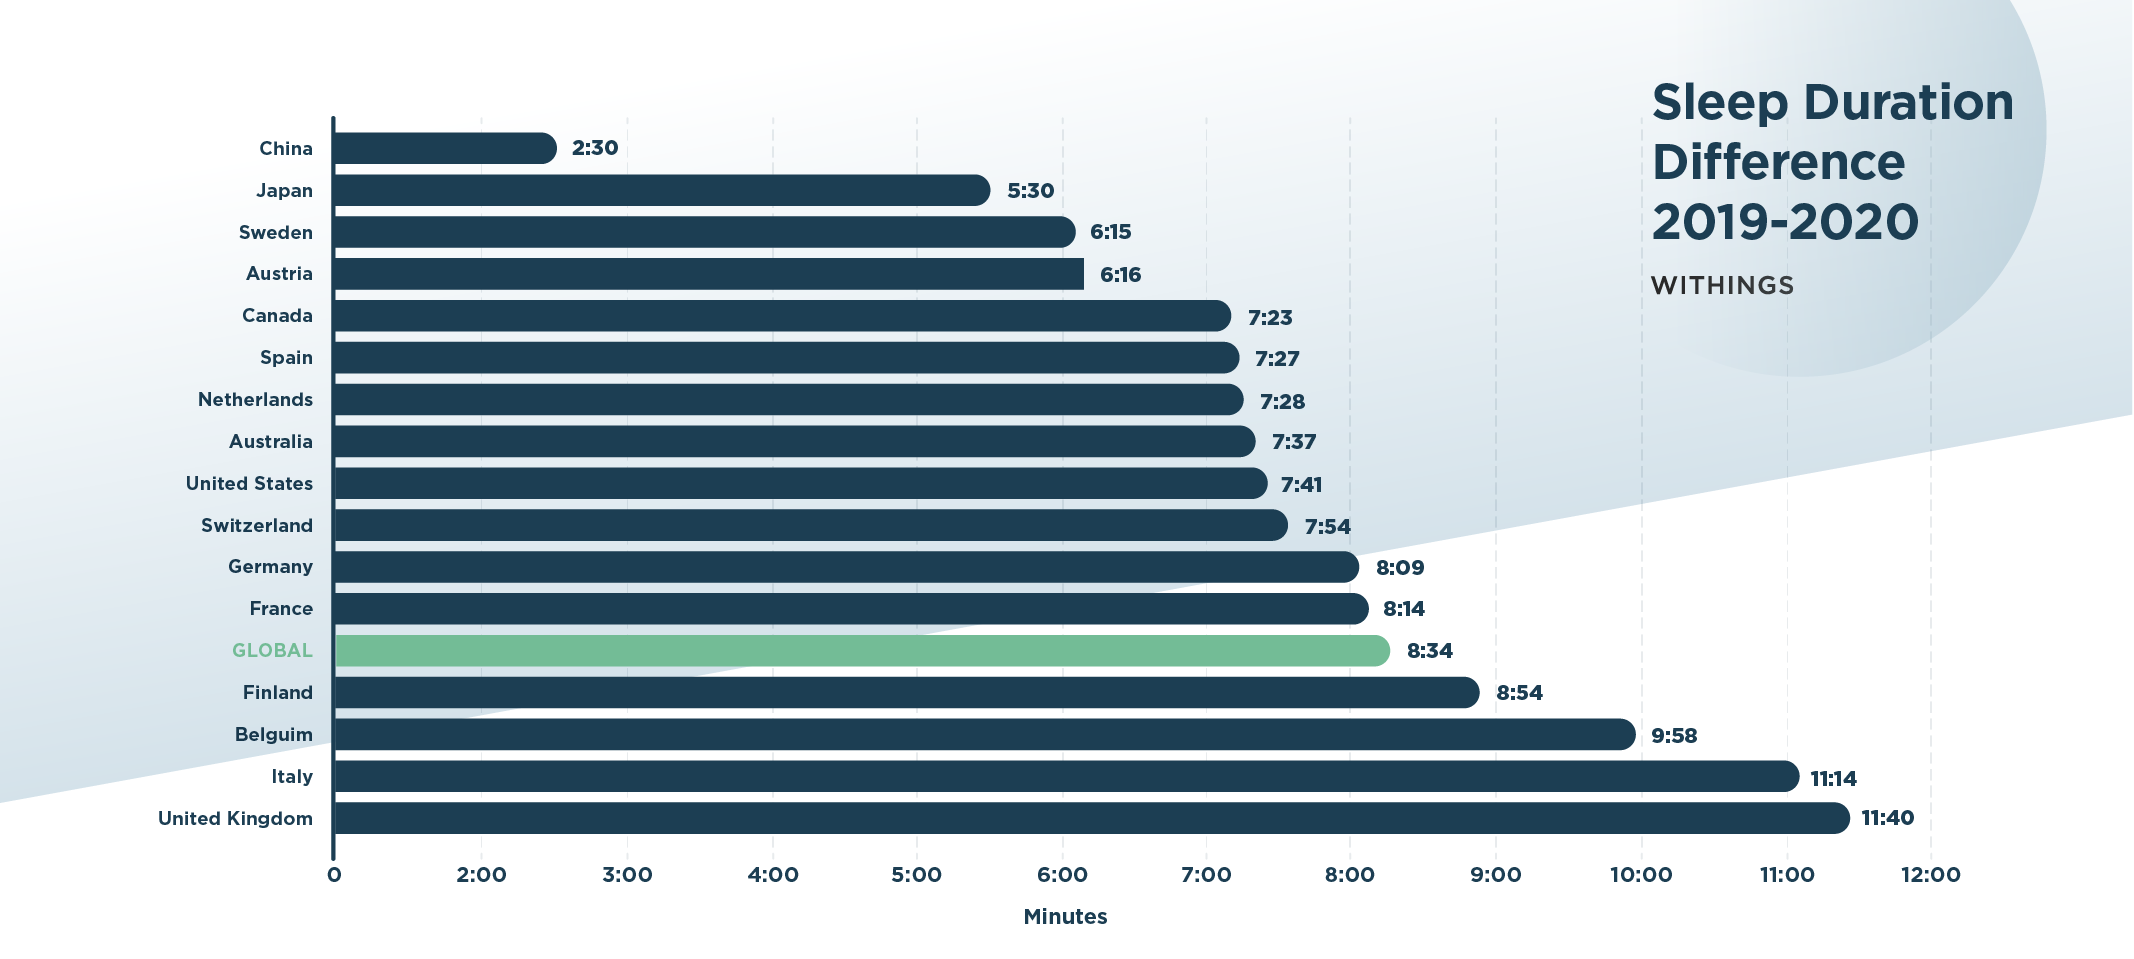
Why would sleep times increase? A drastic drop in nightlife activities in areas like the U.K and massive decreases in restaurant patronship in the USA (to the tune of a $240 billion loss) combined with mandatory curfews around the world most likely led to an increase in the quantity of sleep. The work-from-home push is another factor that has allowed many office workers to skip their commute thereby allowing for a potentially longer sleep time.
One interesting exception? On election night, November 3rd. Although the official presidential results were not announced until the 7th, the night of the elections proved to decrease people’s sleep time in the United States and other countries, but the U.S. lost almost 25 minutes of sleep with 6 hours and 53 minutes versus the regular 7 hours and 18 minutes.
In addition to longer sleep times, sleep quality seems to have increased across countries. As shown below, 2020 saw an increase in high sleep scores that had the overall effect of reducing medium and low scores compared to 2019.
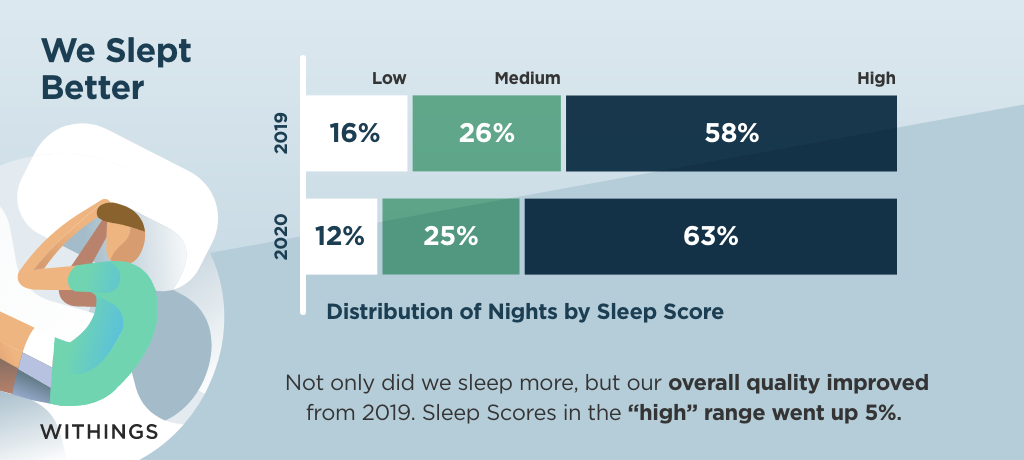
Potential scores include 75+ high, 50 – 75 medium, and 49 or below as low. Sleep scores are calculated using four factors:
- Duration (total time spent sleeping)
- Regularity (consistency between time to bed and time to wake up)
- Depth (part of night spent in restorative phases and deep sleep)
- Interruptions (time spent awake)
What could have caused higher sleep scores besides longer sleep times? Reduced noise from nightlife around cities might be one reason, but another could be less social jet lag due to reduced time spent socializing and partying later into the night compared to regular workday sleep times. No house parties and generally no space to gather other than the same ol’ digital screen means people could be maintaining a more regular sleep schedule throughout the entirety of the week.
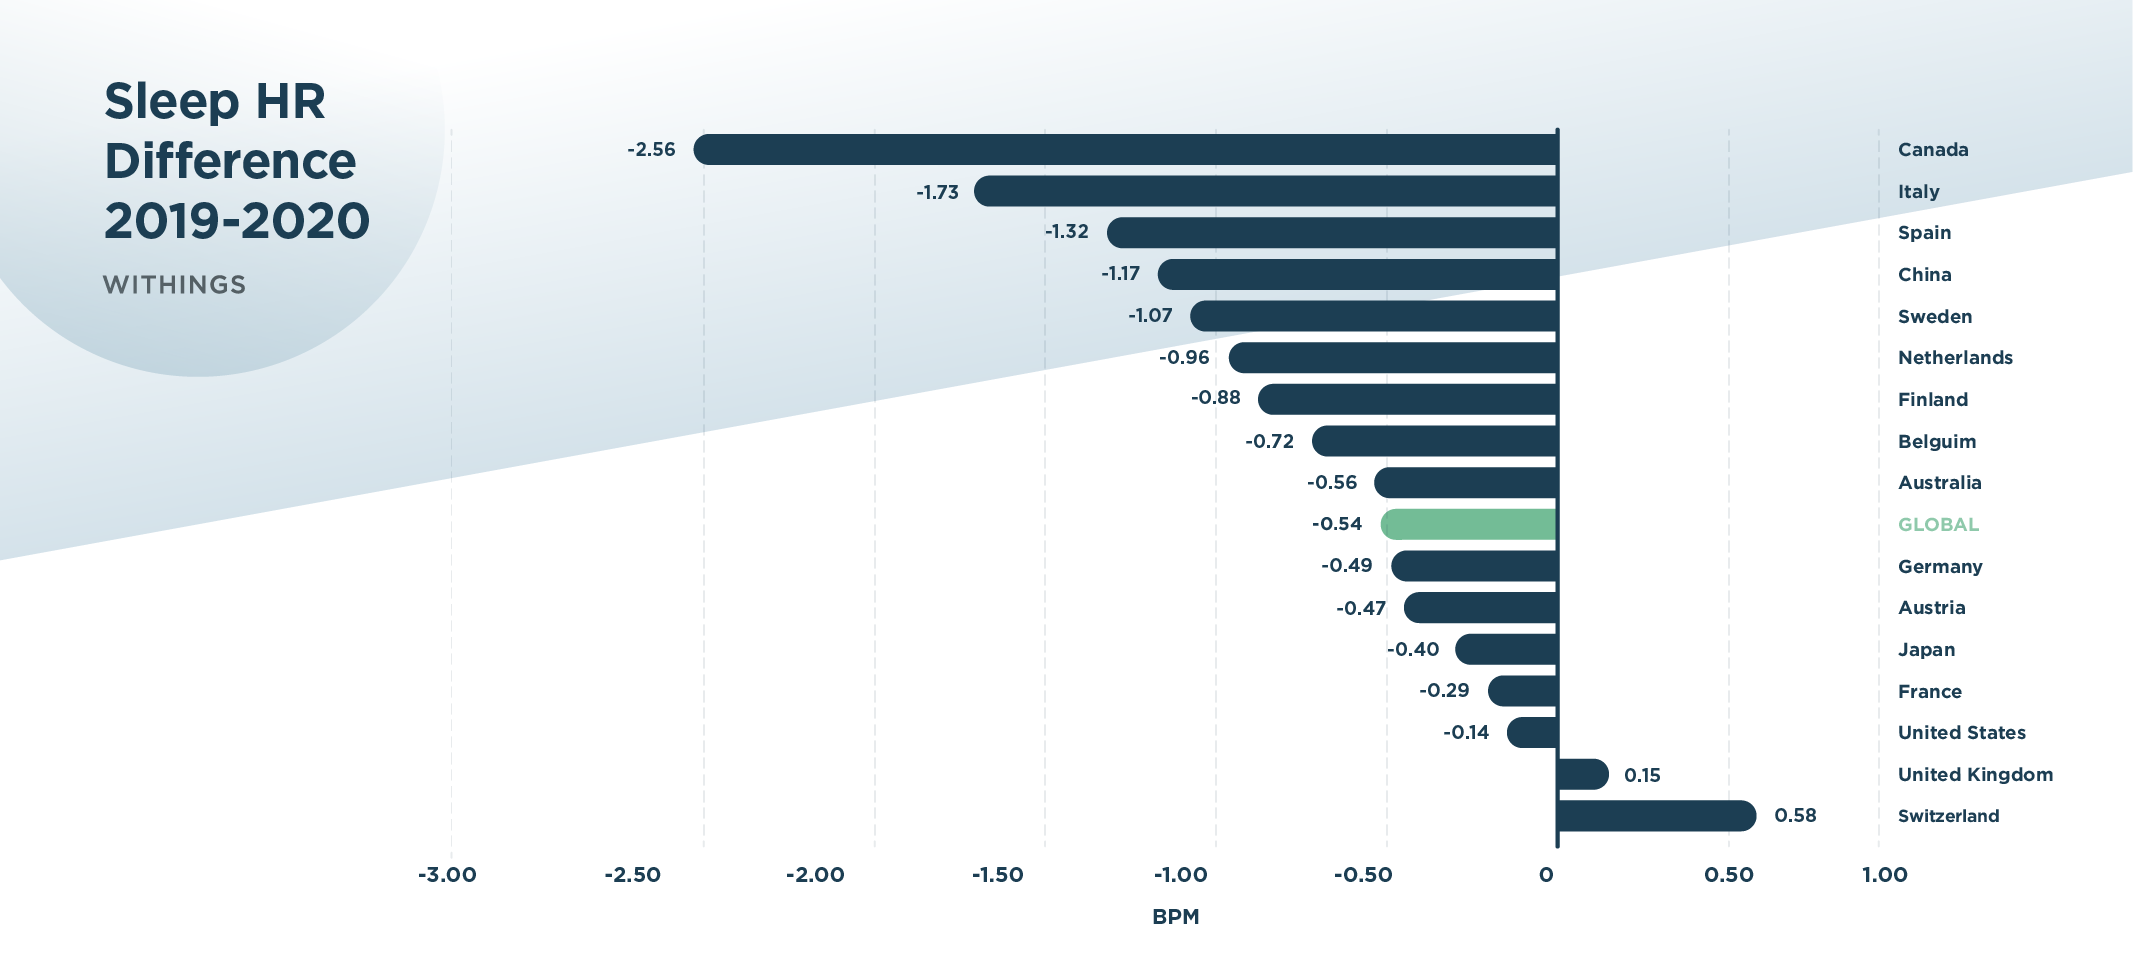
Longer sleep times and higher sleep scores are positive, but how have the other happenings of the world affected health? We looked at sleep heart rates. A lowered sleeping heart rate is a sign of good health as this means the heart does not have to work as hard to pump blood. So, what does the data say? Again, between 2020 and 2019 another positive difference is seen with sleeping heart rates at an average of 0.54 beats per minute (bpm) lower this year versus last. However, not all countries experienced the same drops. Canada blows it out of the park with a reduction of 2.56 bpm while only two countries saw increases, the UK and Switzerland which saw an increase of 0.15 bpm and 0.58 bpm.
We speculate that many of the factors mentioned above, including stay-at-home orders, less nightlife and alcohol consumption, and reduced stress from commuting have affected heart rates.
We slowed down
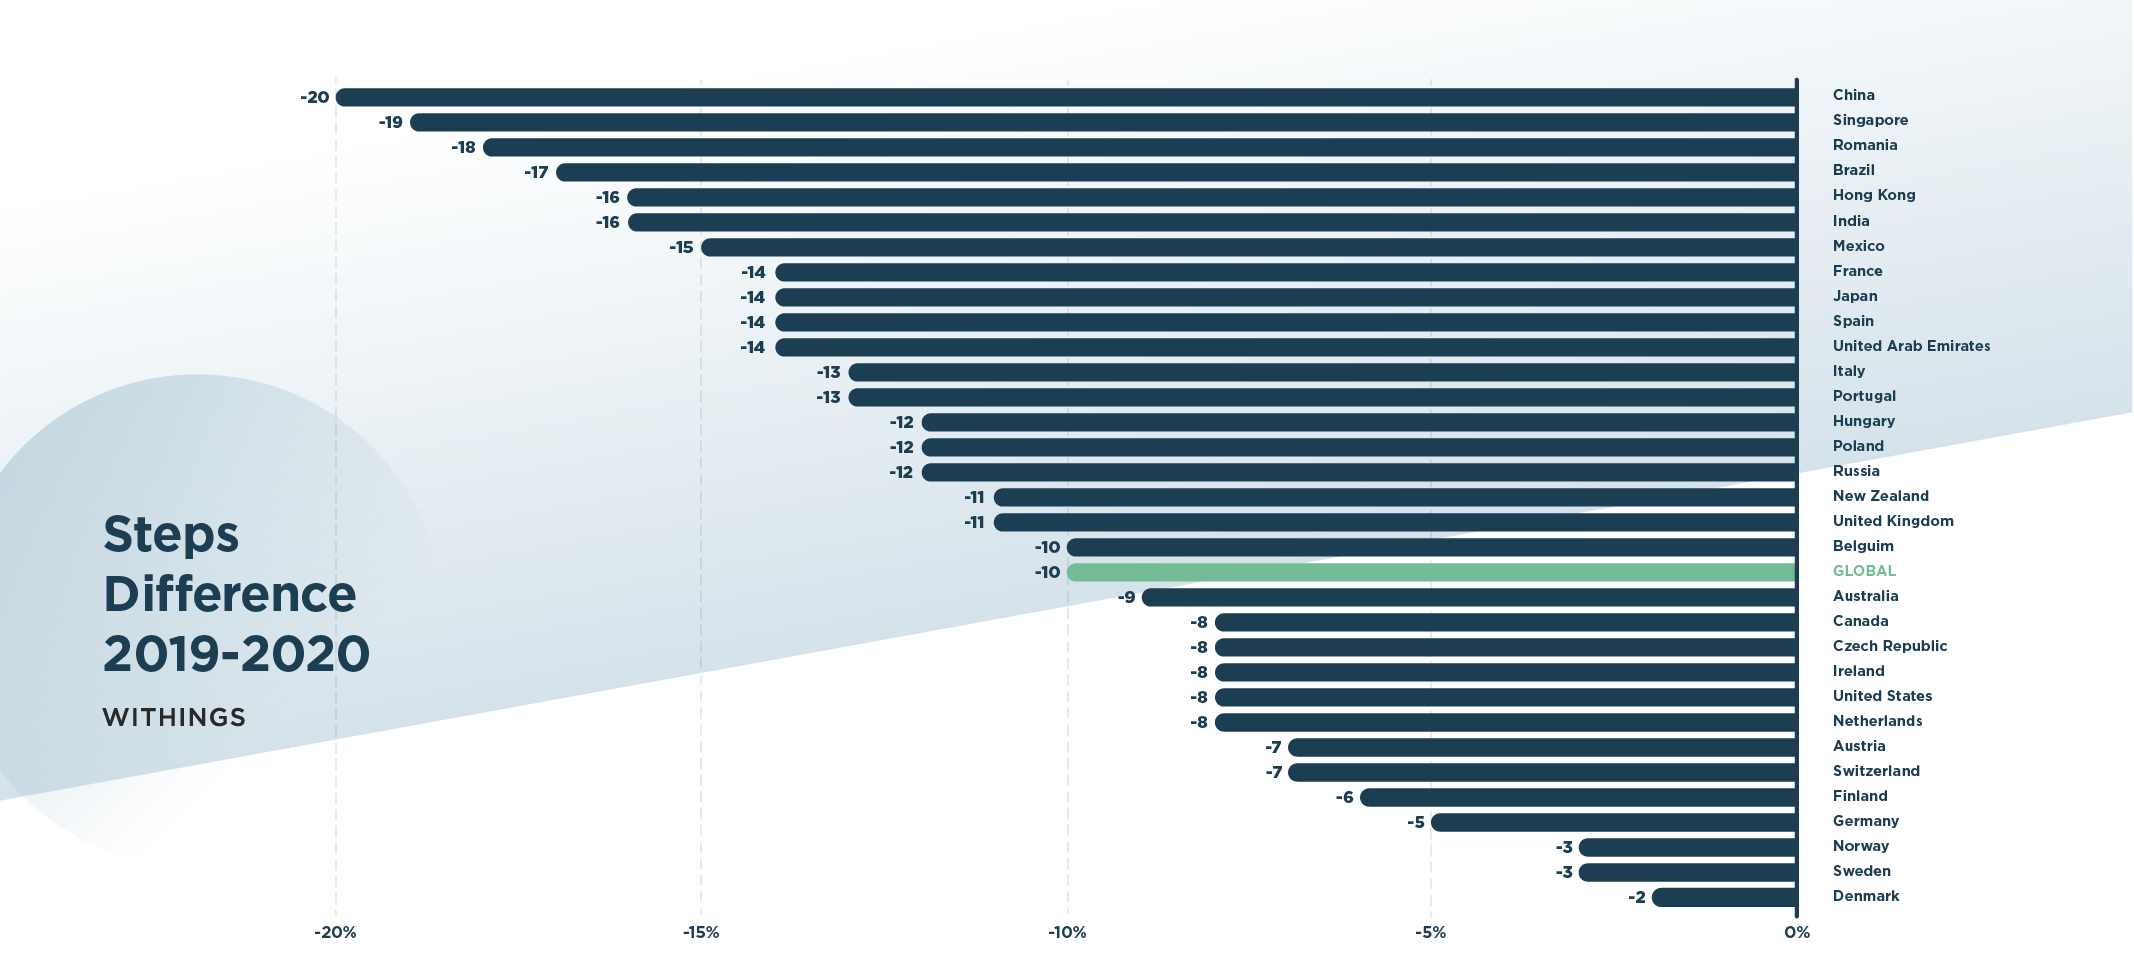
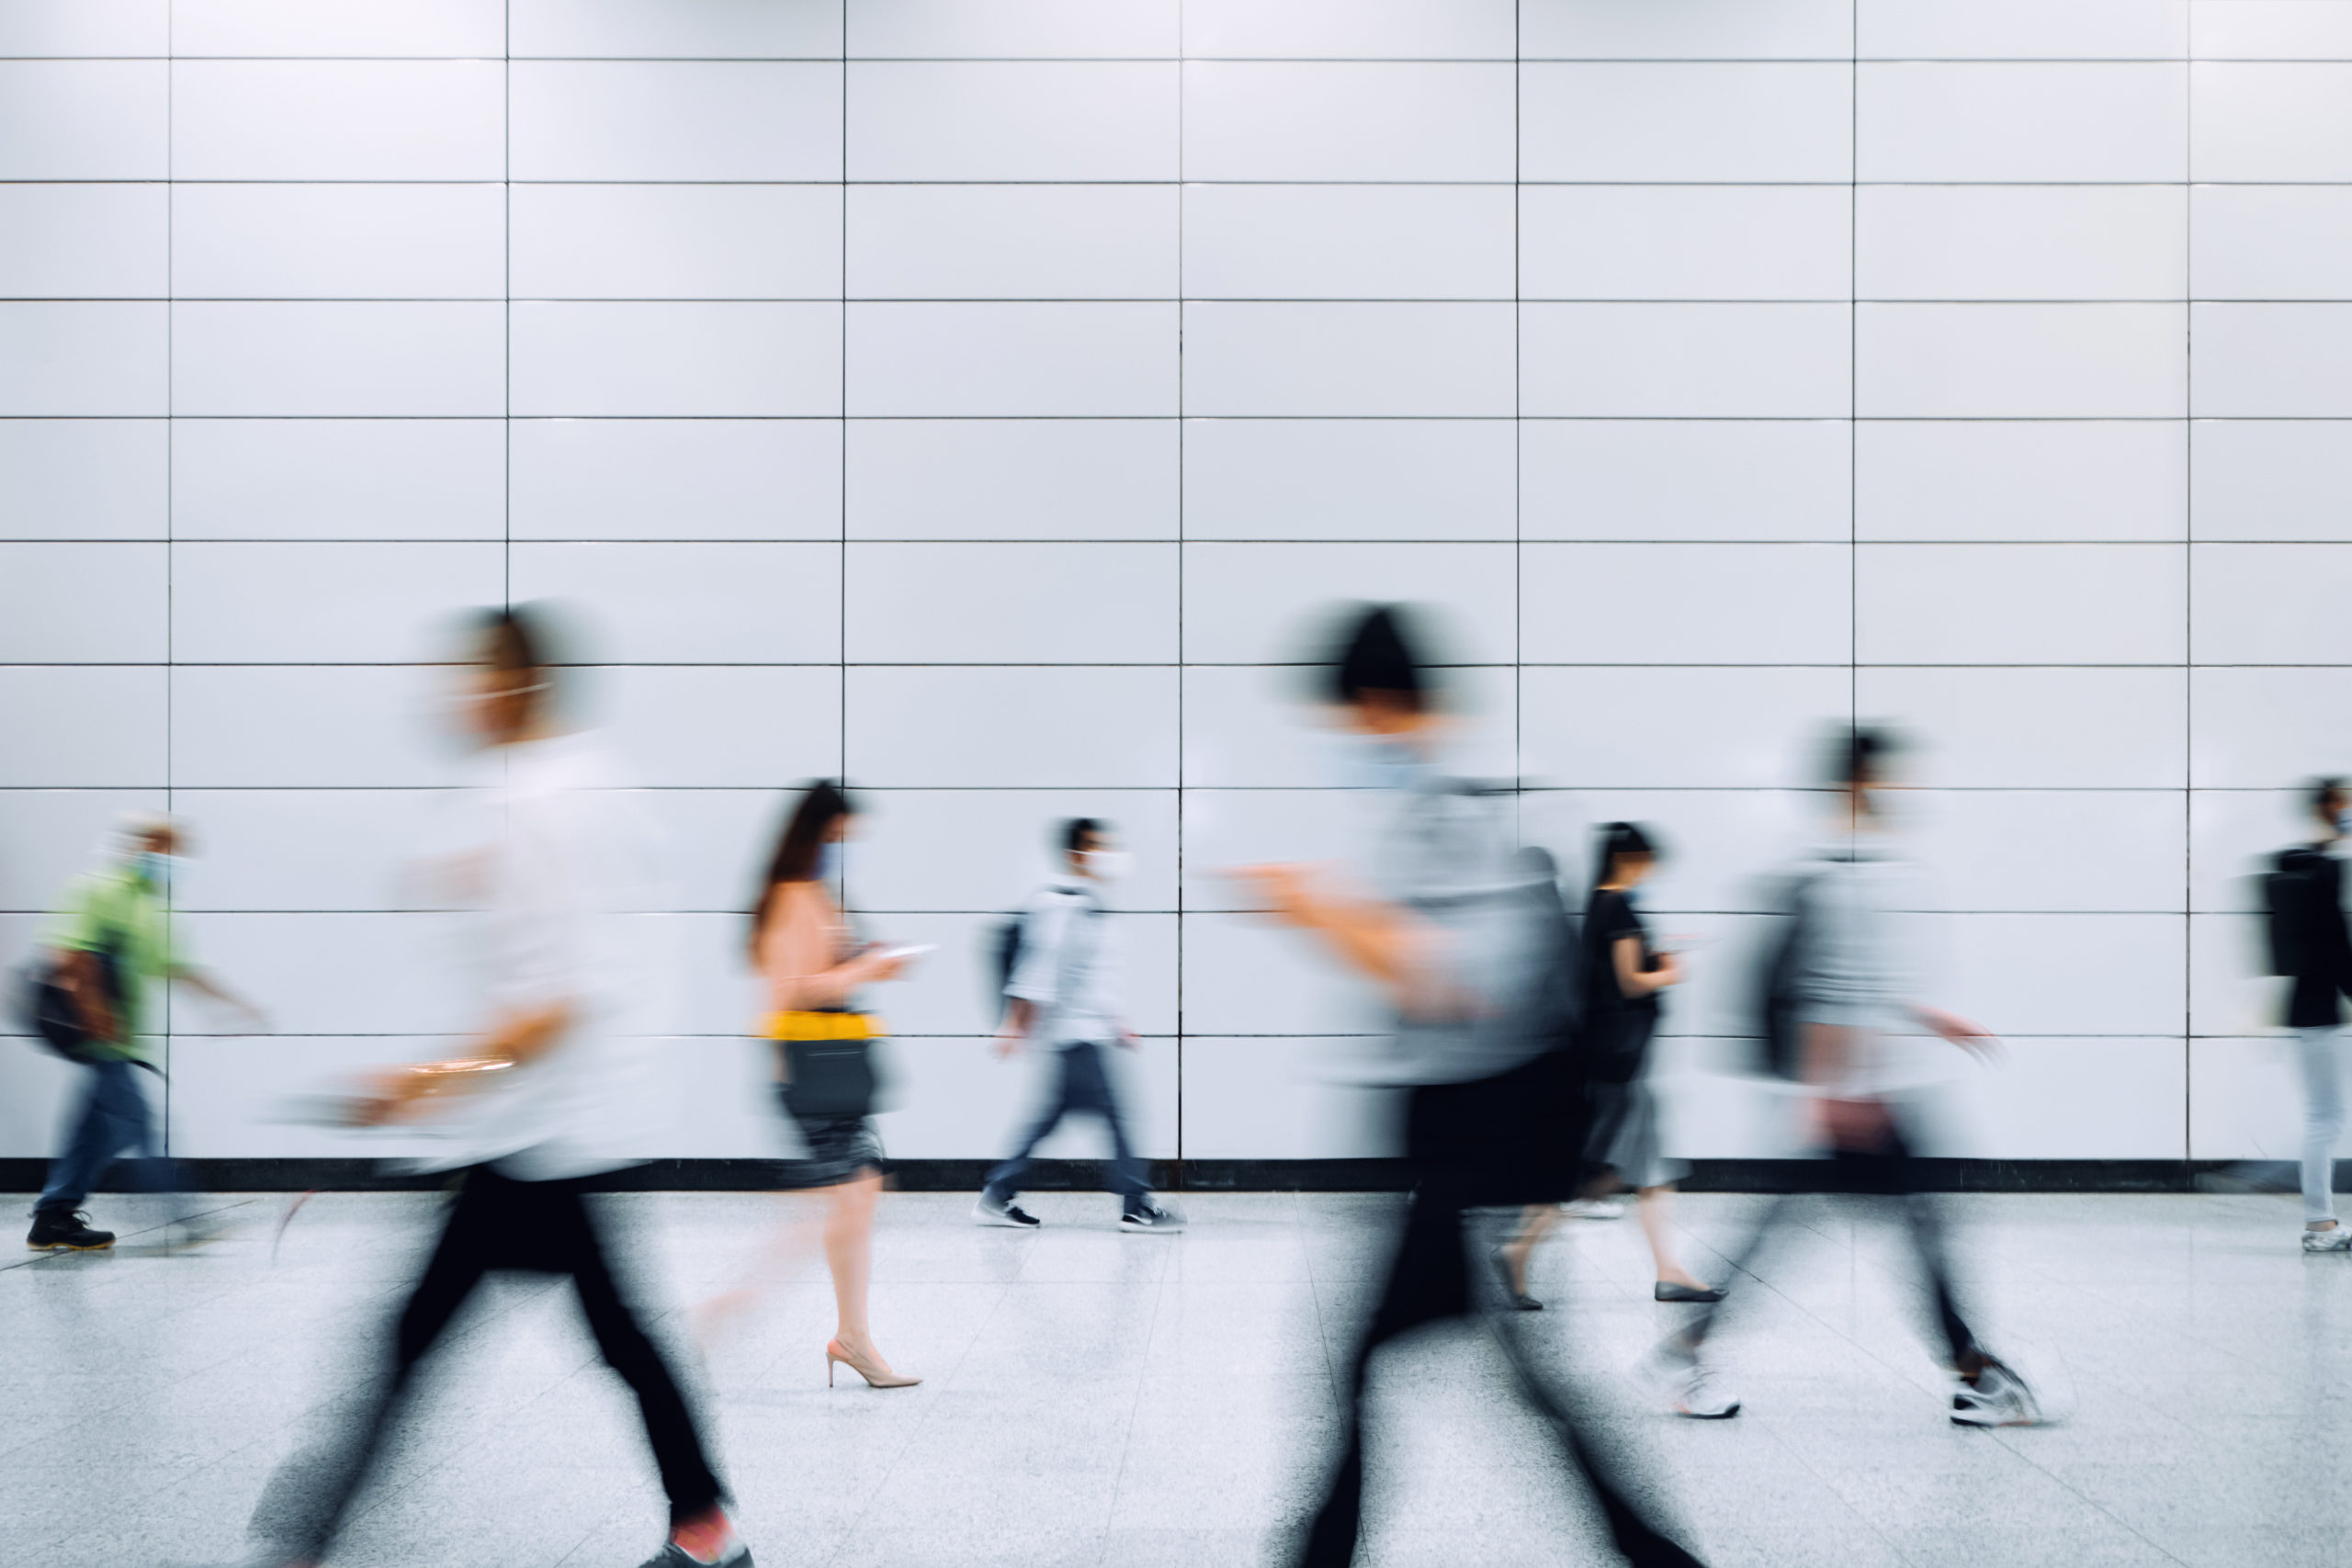
Quarantining has had a huge impact on our walking schedules with a global average of -10% or 511 less steps per day walked in 2020 versus 2019. Beyond the mandatory stay-at-home orders in place in many countries around the world, the lack of steps may also be traced to reduced work commutes and the lack of walking that would otherwise take place at work. Almost twice as many employees are working from home as at work in places like the United States of America, so the disappearance of walking to the train or bus station, switching lines, and repeating it all over again at the end of the day may be one example of why the globe now experiences less steps.
However, one country in particular that is now known by the world for not having taken many restrictive measures compared to its neighbors, Sweden, had one of the smallest losses of activity with only 87 steps per day on average less than 2019.
Steps in general can be one measure of activity, but how were workouts affected?
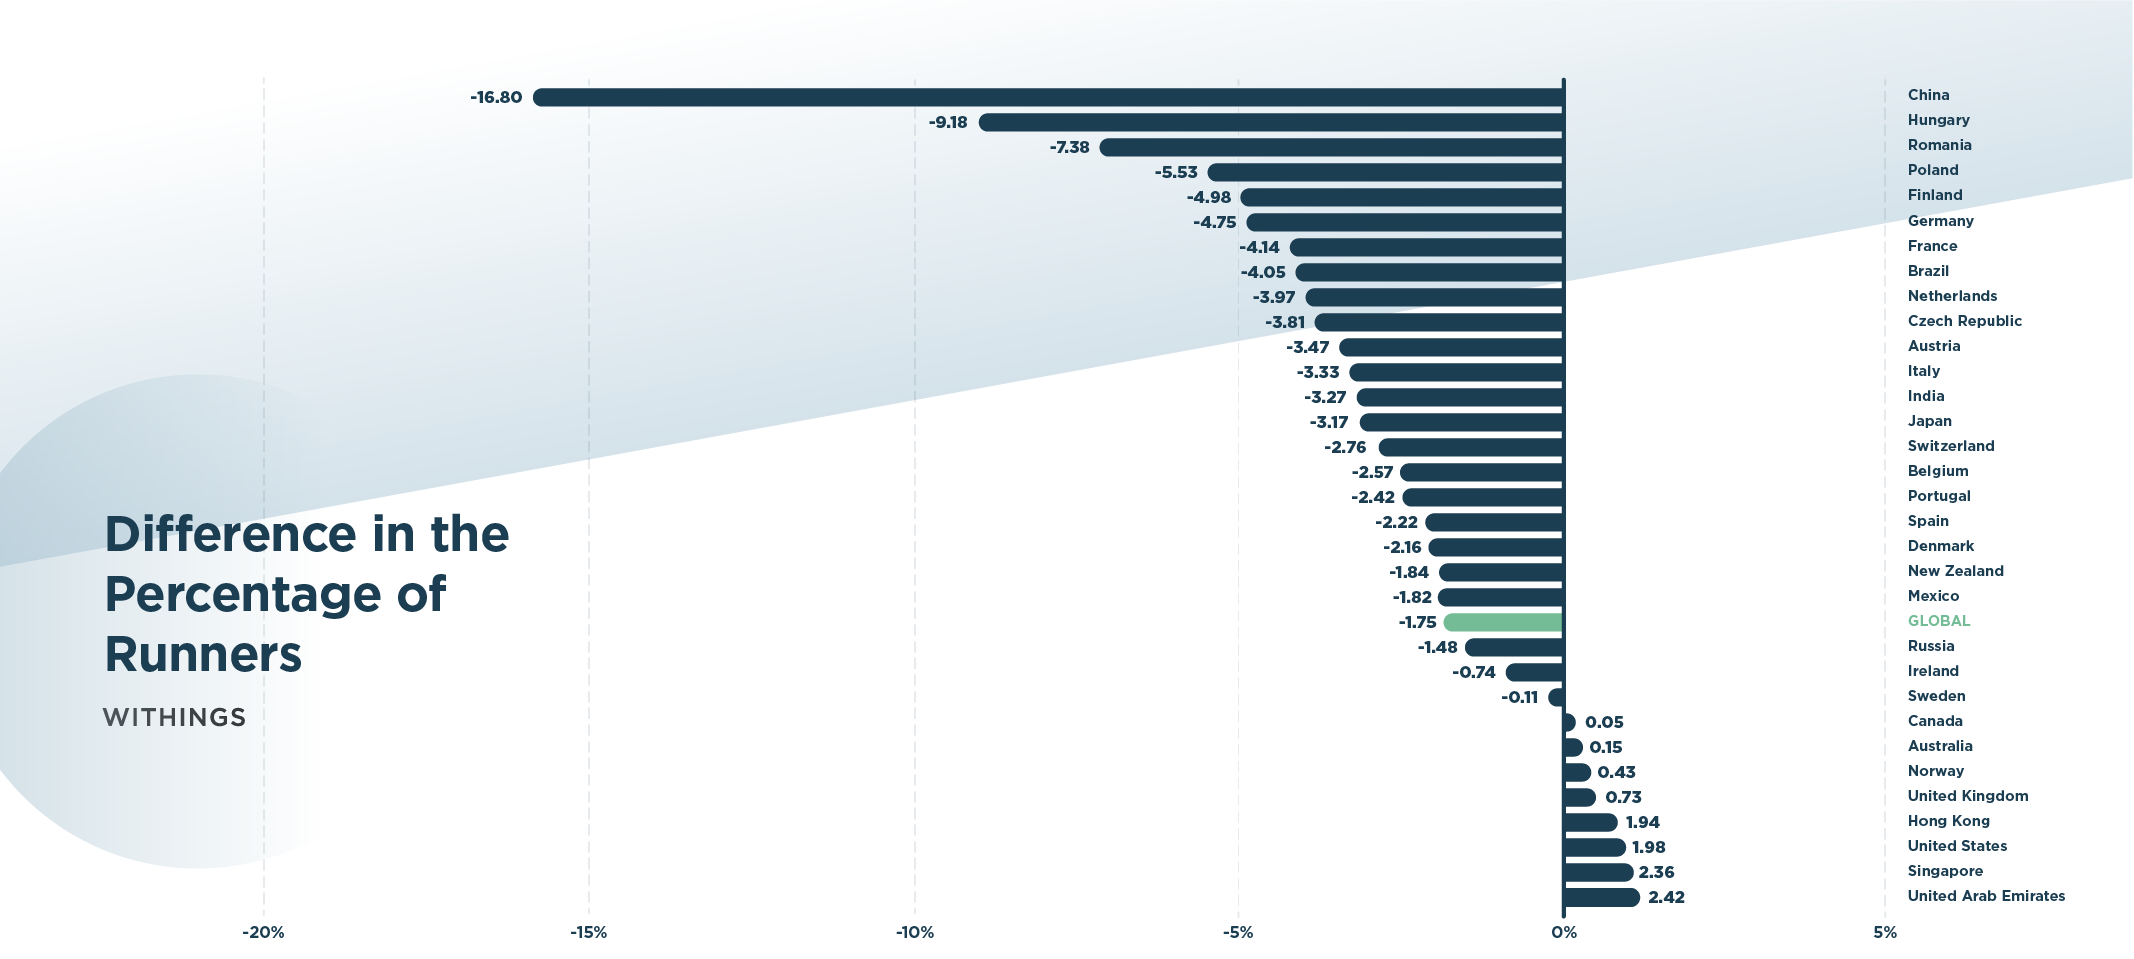

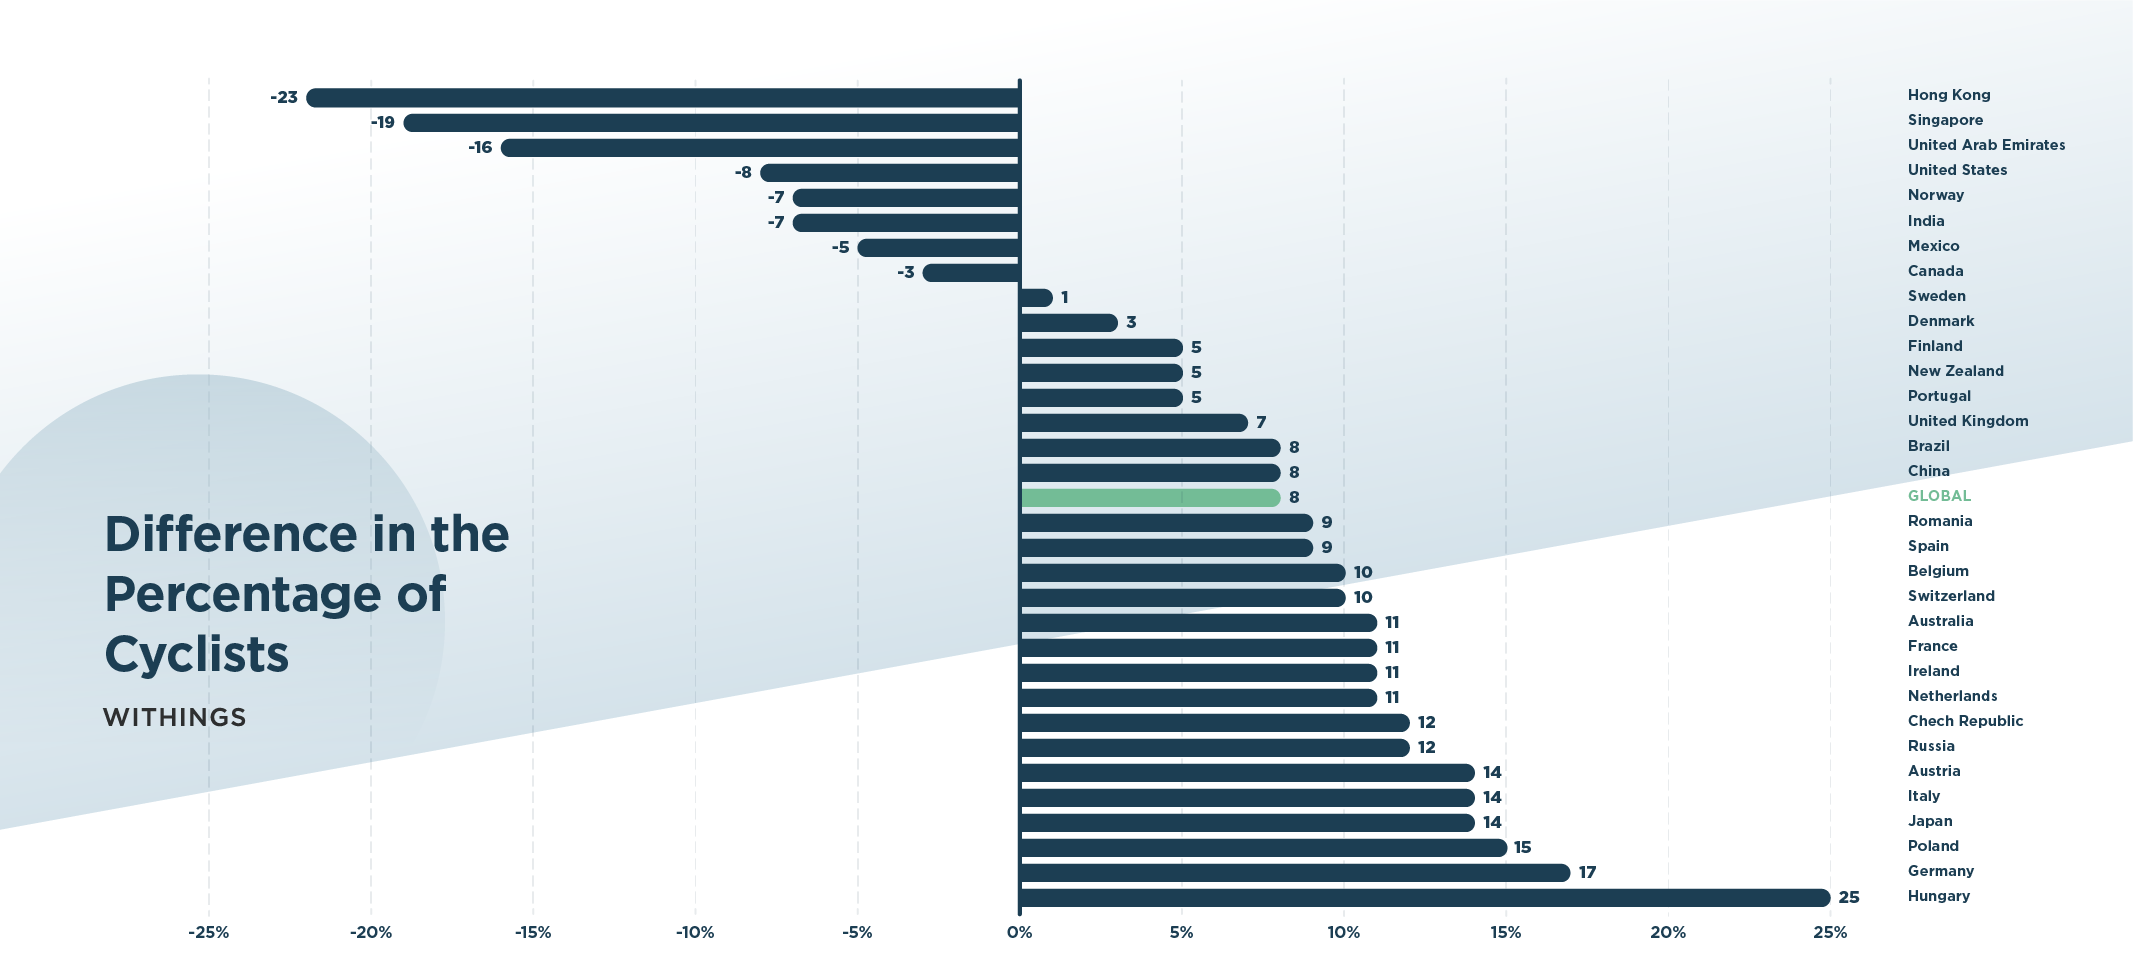
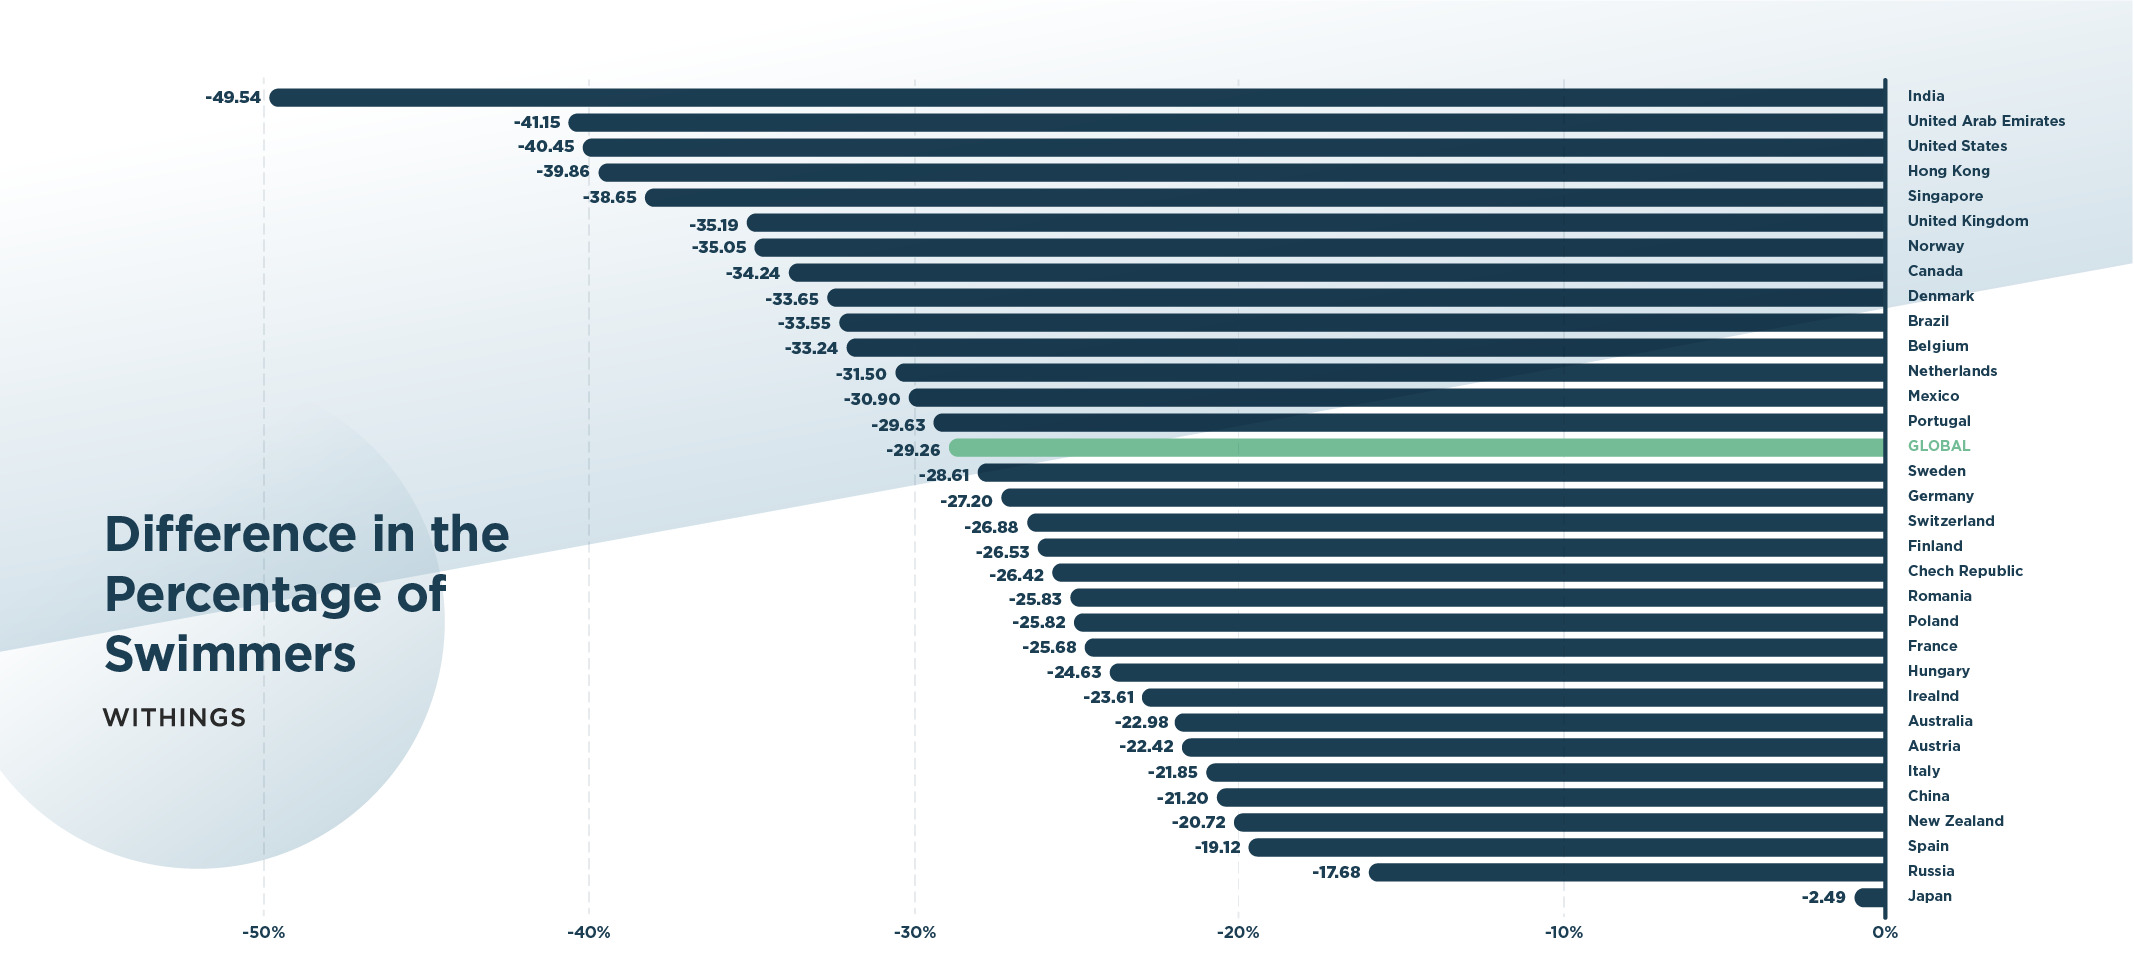
Working out indoors was difficult for many people as gyms were closed or operating at reduced capacity, and in several countries it was forbidden to step outside unless necessary. Running fell by a global average of 1.75% while swimming took a dive of almost 30%. However, some workouts were affected less than others. Biking saw a global rise by 8%, and this could be due to many countries having increased the number of bike lanes throughout major cities as biking to work or around town with constant wind ventilation feels safer than sharing train space with fellow passengers.
Weight until you hear this…
Some activity is up and some workouts are down, but how did all of these factors combined with sleep, quarantining, and everything else affect weight? Was 2020 truly a dumpster fire for the kilos or pounds we chose to measure?
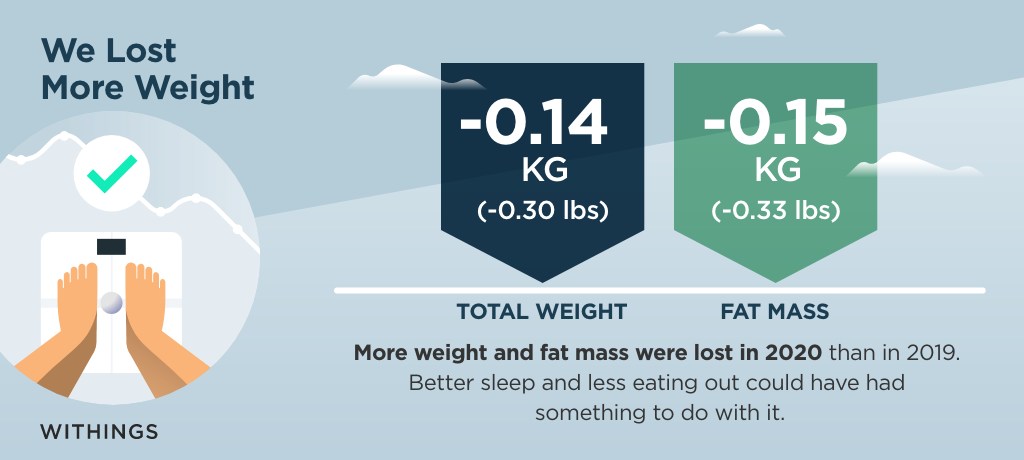
The numbers are in, and they show that globally 2020 showed a greater average weight loss by 0.14kg compared to 2019. The good news continues with 2020 showing a greater global average fat mass loss of 0.15kg compared to 2019. These numbers might seem anti-intuitive to the incredible amount of stress, despair, and increased proximity to the fridge many might be feeling, but when considering many of the factors already discussed, this general trend towards not gaining weight makes sense. Sleeping more and with less social jet lag as described above can lead to greater weight loss, and while many restaurants and cafes have suffered from less patronage, more people are eating at home which means less calories, salt, and saturated fat along with healthier food choices.
General weight is not trending upwards, but as the Year of the Pandemic has taken an emotional and mental toll on everyone, how has this changed our personal goals towards losing weight? Have we given up all hope and just Netflixed and chomped, or has this collective challenge spurred us into personal action?
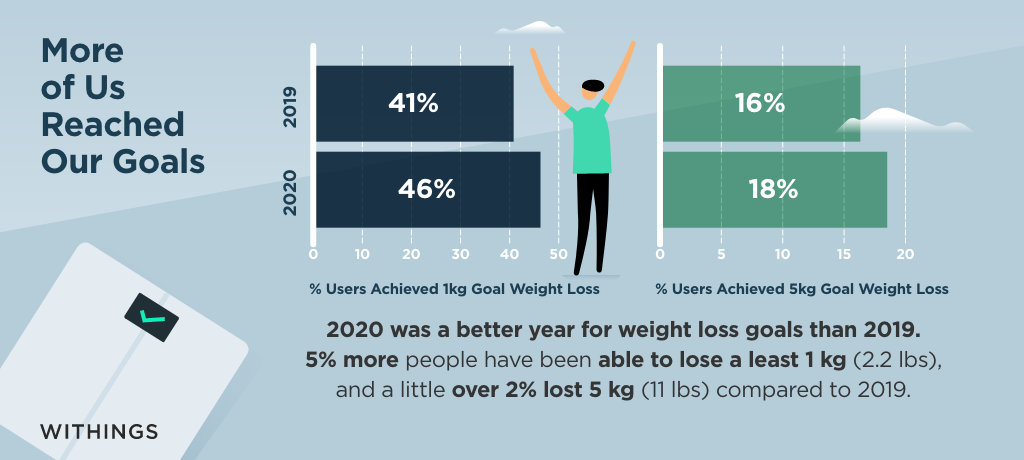
In 2020, 46% of users who have wanted to lose at least a kilogram (2.2 lbs.) have managed to lose weight, and 18% of those who have been more ambitious and wanted to lose more than 5kg (11 lbs.) did so. In 2019 those same numbers were 41% and 16% which shows that 2020 has been a better year for weight loss goals than 2019.
Temperature checks spiking?
Activity, sleep, and weight have all been affected globally during 2020, but has the pandemic turned up the heat on people taking their temperatures? Experiencing a high temperature similar to flu symptoms is one potential indicator of having COVID-19. So, did the global community take more temperatures in 2020 than 2019?
In the graph below there is a u-shaped pattern during 2019 that follows normal temperature taking rates, and people generally take less readings in summer versus fall and winter due to flu season. However, in March of 2020 during the first peak of Covid-19 in Europe and the United States, there is a sharp increase in the number of temperatures taken.
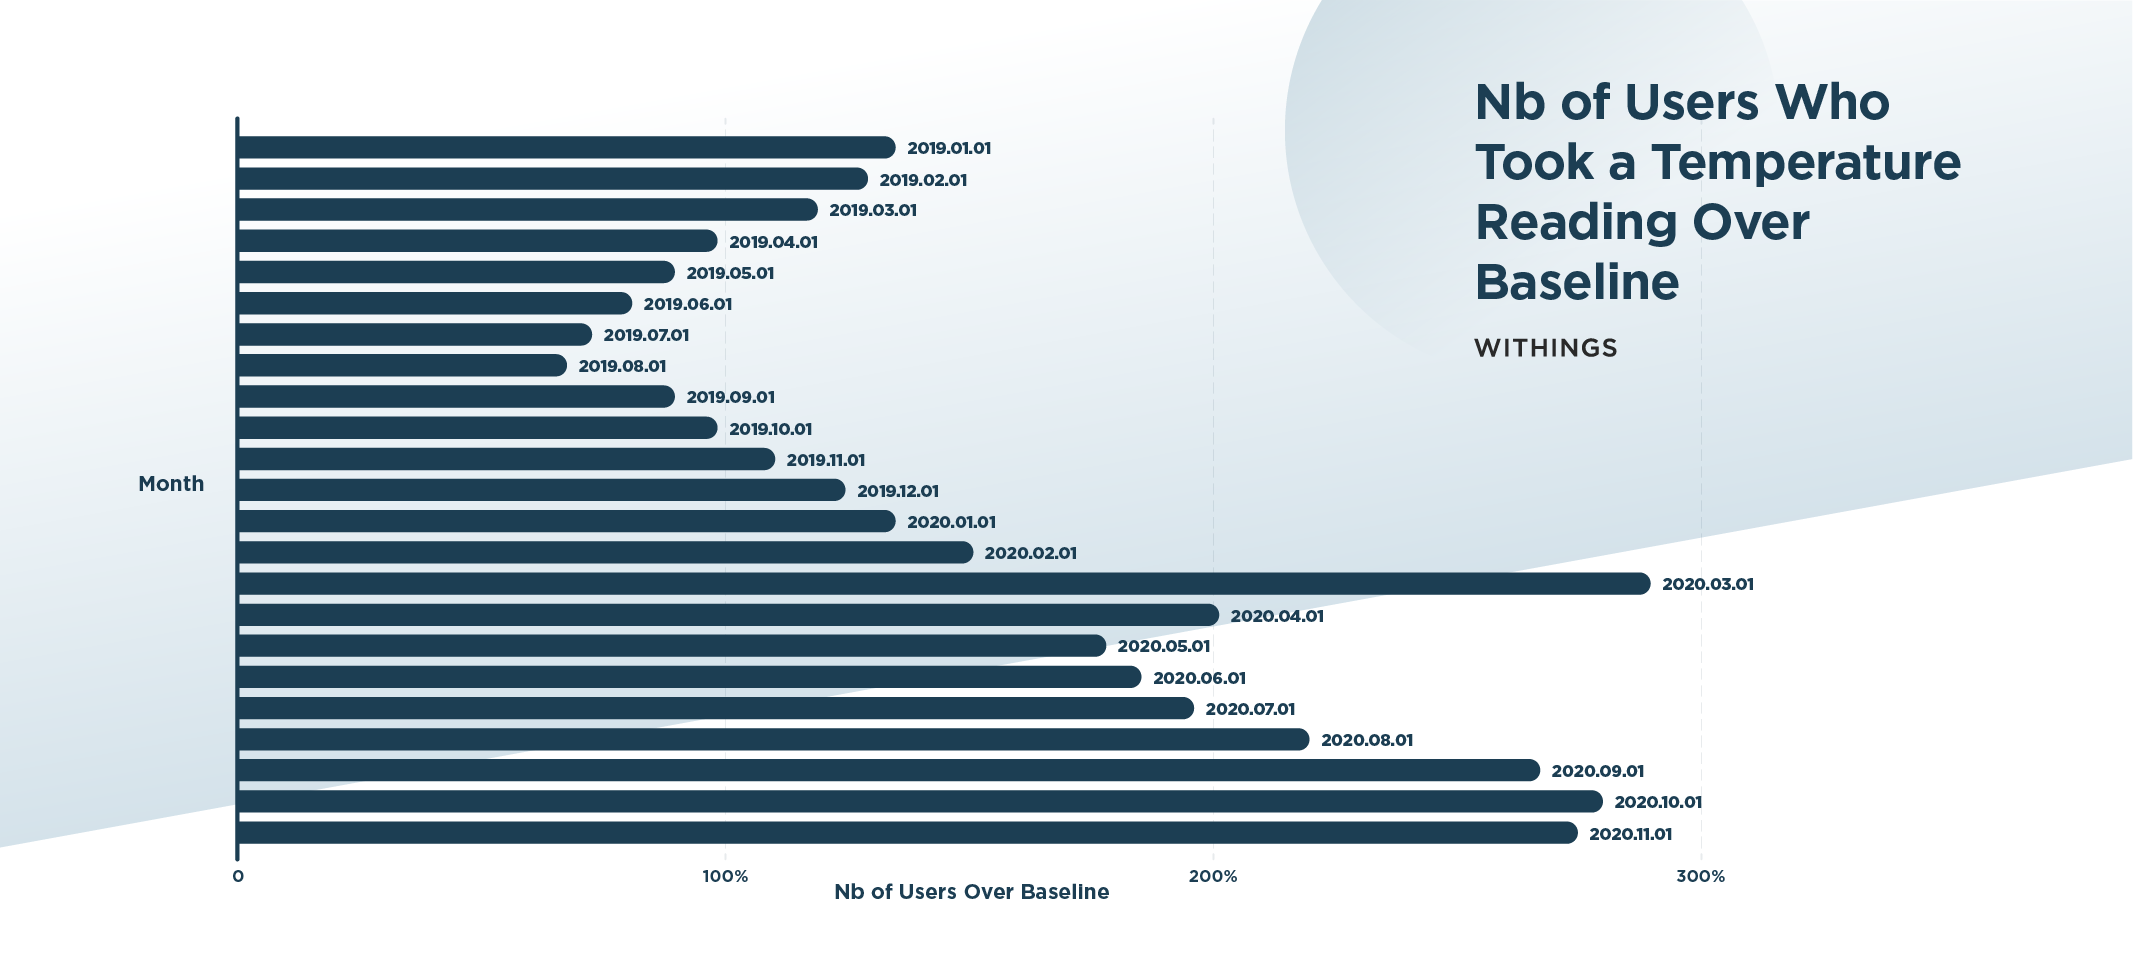
Another u-shape pattern emerges heading into summer but one that lacks the gradual consistency seen in 2019. Even the lowest amount of temperatures taken in a COVID-19 world during the month of May does not fall anywhere towards the highest rates in 2019, and the number of temperatures taken in September and beyond in 2020 remain close to March levels.
Although some infected people with COVID19 can present as asymptomatic, many businesses, workplaces, and schools have increasingly used temperature readings as a gauge to assess whether someone should enter a building or not. At-home temperature measurements by individuals to detect potential COVID-19 symptoms have also risen, and taking temperatures could be a more prevalent measure at an institutional level even in a post-pandemic world.
Conclusion

Was 2020 a dumpster fire? In many ways, yes, but for health extending beyond those directly touched by COVID-19, the data says the year has been more of a slow burning ember: there’s heat, but it’s not out of control spewing garbage smoke everywhere. In fact, there are positive trends specifically with sleep and weight that can be attributed to eating more (and healthier) at home, more time to sleep since commuting to work has decreased, and less social jet lag from what used to be late nights out. However, general activity has gone down and some workouts have bottomed out, and more temperatures are being taken than ever before.
But no doubt 2020 absolutely feels like a dumpster fire for a variety of reasons including social isolation, job losses, and death from COVID-19, all of which cause us to feel fear, anger, uncertainty, and sadness. The data cannot put a sunny picture over a year that has revealed incredible inequalities among populations in certain countries and for others a lack of collective knowledge concerning public health. Yet throughout the madness and disappointment, we can take some solace in knowing that there is hard health data from millions of us that say we’re not doing as bad as we think we might be, and in fact, if we act on the data, we could potentially improve human health by developing policies which shape behavior towards better sleep, healthier eating, and improved weight.
Methodology
This study was conducted by Withings based on anonymous aggregated data from a pool of 5 million users of the Withings smart scale, hybrid smartwatches, and smart thermometer from around the world. Withings guarantees the confidentiality of personal data and protects the privacy of all its users. Therefore, all data used for this study was rigorously anonymized and aggregated in order to avoid any re-identification.